Fastest market ever & price deceleration

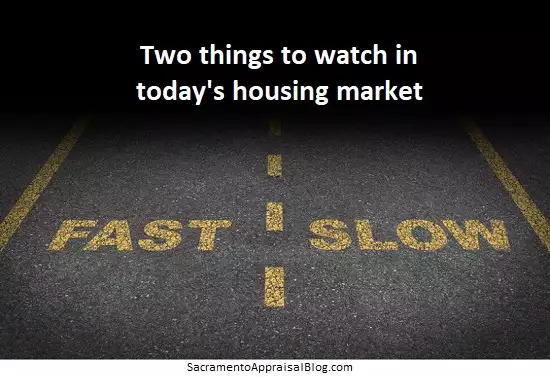
The housing market has been changing these past couple of months. As I’ve been saying, it isn’t cold, but the temperature is surely different. Anyway, let’s talk about two things to watch in months ahead – price deceleration and days on market. Any thoughts?

A photo of a road with two lanes. One lane says "fast" and the other says "slow." There is also the title of today's post, stating, "Two things to watch in today's housing market."

This post feels a bit nerdy or heady, but this stuff is so important. I hope you pick up a few nuggets – even if you aren’t local.

1) PRICE DECELERATION:

When this year began, lots of people predicted and hoped for price deceleration. The idea is price growth would slow, so instead of being 20% higher compared to last year, the percentage would start to be lower over time.
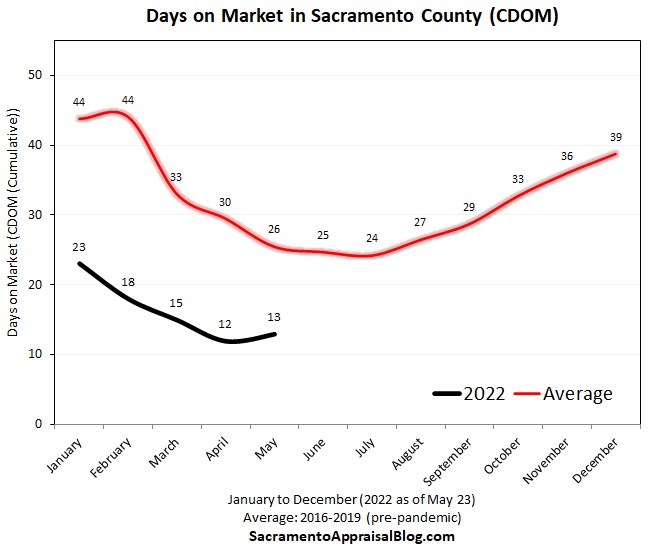
  • It’s possible we’re starting to see deceleration in the stats, but we still need a few months to be sure. See image.
  • We’ve been growing at a freakish pace, and we need to see slower growth for the sake of health.
  • This doesn’t mean prices are declining, though some sellers have priced lower than recent sales to generate interest (or multiple offers).
  • Last year was really aggressive and this year the market crested a month early. In short, let’s be aware of what we are comparing.
  • Not every local county is showing deceleration like the regional image. This is why I’m saying we need a few more months of stats. This is simply a preview of some trends on my desk. Frankly, it could take a bit to see price deceleration in the stats, but let’s be on the lookout.
  • A lline graph to help show price deceleration starting to happen.

    2) DAYS ON MARKET:

    I have some brand new visuals to help us watch how long it is taking to sell so we can gauge a change in temperature. Do you like these?

  • We’ve had the fastest market ever over the past two years.
  • It’s starting to take slightly longer to sell.
  • We are still quite far from a normal trend (the red line).
  • Pendings are moving quickly, but let’s not forget to look at what isn’t selling too (properties with price reductions).
  • I expect to see the black line (2022) tick up in coming months.
  • For the sake of market health, we want to get closer to the red line where it’s taking 30 or so days on average to sell.
  • A line graph to show multiple years of days on market in Sacramento County. This shows the past two years have been the fastest-moving years ever compared to all other previous years

    A look at the average and 2022 days on market. A l ine graph to show these two years.

    A line graph to show that we've had the most aggressive market ever over the past two years

    TOP GUN REAL ESTATE MEMES:

    Lately I’ve been making more real estate memes. It’s just how my brain works. Anyway, Top Gun 2 is coming out in a few days, so I give you the following. The second meme alludes to buyer “love letters.”

    A meme showing Tom Cruise shake Val Kilmer's hand (Top Gun actors). The title says "Sellers finally negotiating a bit more with buyers."

    Another Top Gun meme. Tom Cruise is singing to Kelly McGillis with other people in the background in a bar. The title says, "Buyers trying to impress sellers without violating fair housing laws of course."

    MARKET STATS: I’ll have lots of market stats out this week on my social channels, so watch Twitter, Instagram, LinkedIn, and Facebook.

    Thanks for being here.

    Questions: What are you seeing out there in the market? What do you think of the new visuals?

    If you liked this post, subscribe by email (or RSS). Thanks for being here.

    Fastest market ever & price deceleration
    You can contact us to get more choices