Wolf Street
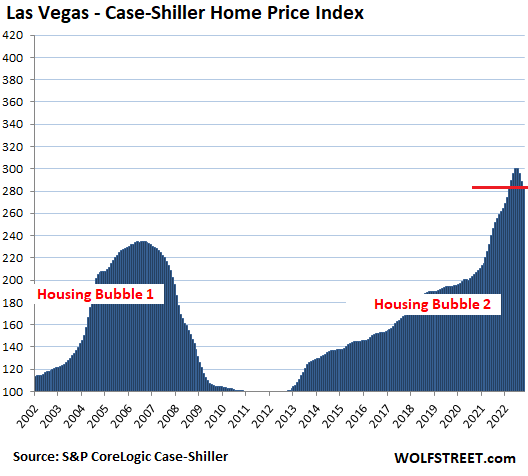
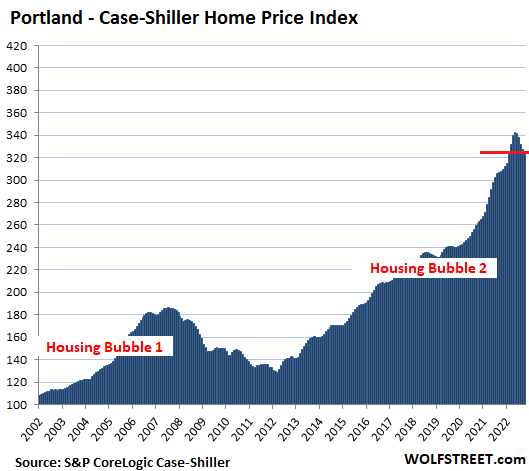
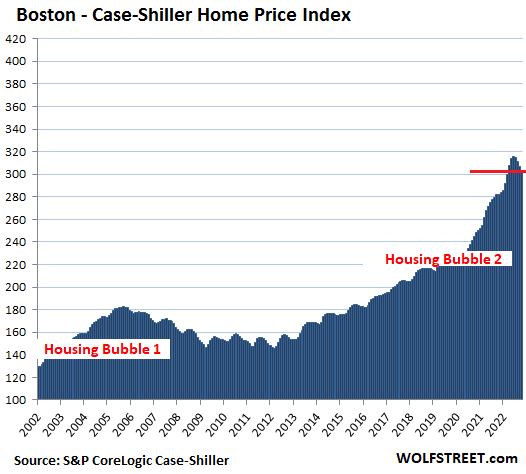
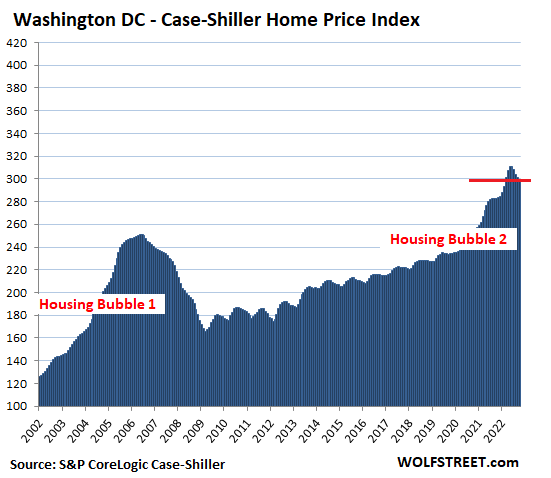
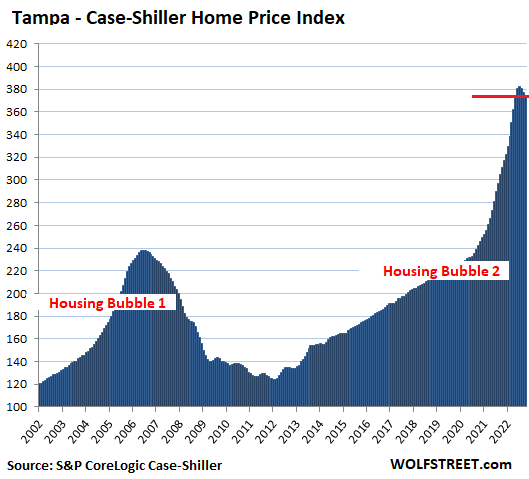
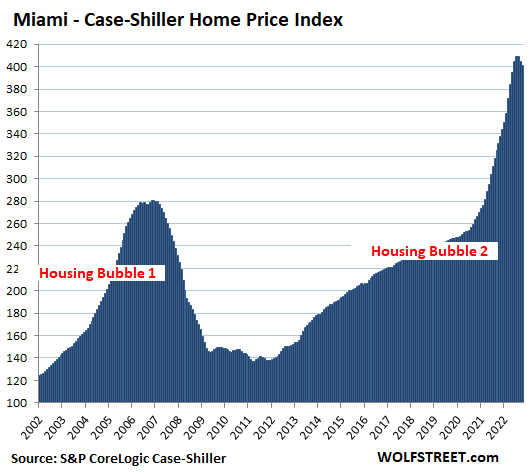
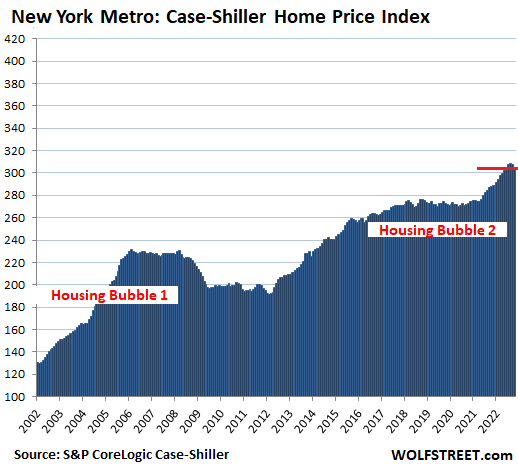
The Most Splendid Housing Bubbles in America, December Update: Now Dallas, Las Vegas, Phoenix Plunge Fastest. San Francisco, Seattle, San Diego Down Most from Peak
No dear, this is not seasonal.
By Wolf Richter for WOLF STREET.
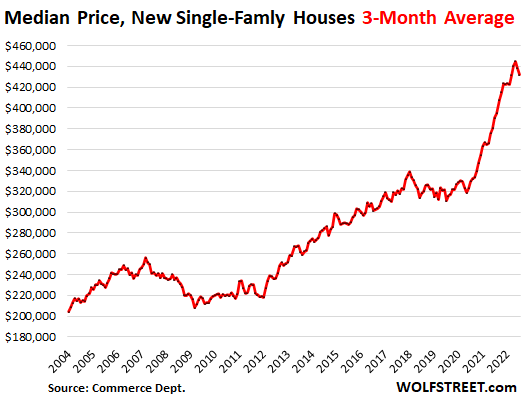
Declines in house prices have turned into a relentless drumbeat. Today, the S&P CoreLogic Case-Shiller Home Price Index for “October” was released. Time frame: A three-month moving average of closed home sales that were entered into public records in August, September, and October; these are deals that were largely made in July through September.
Since then, home prices have dropped
... more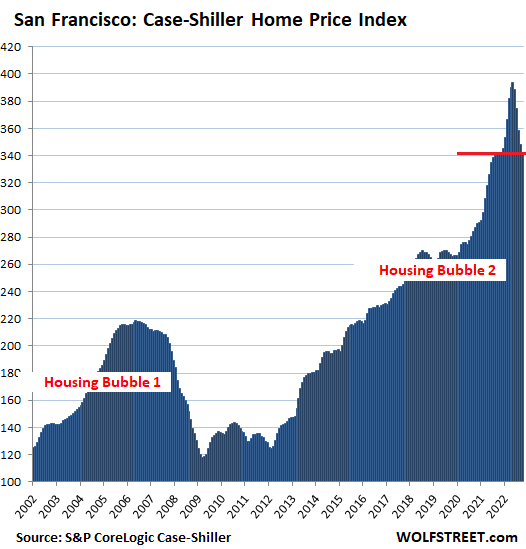
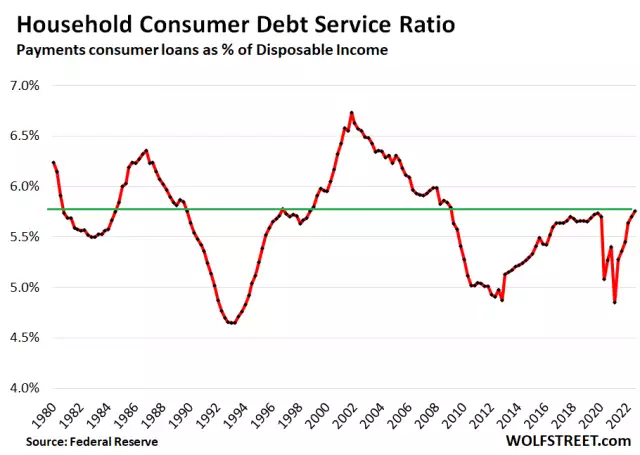
The Price of Easy Money Now Coming Due

How Strung-Out Are Households with their Debt Service & Financial Obligations as the Miracle of Free-Money Fades?
Home Sales Melt Down Nationally to Depths of Housing Bust 1. Prices -10% in 5 Months. Cash Buyers, Investors Massively Pull Back
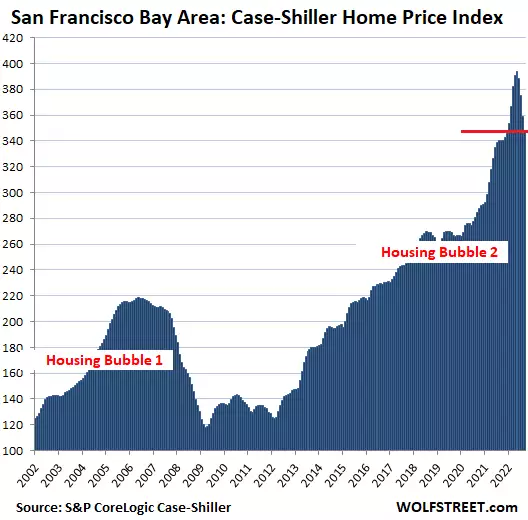
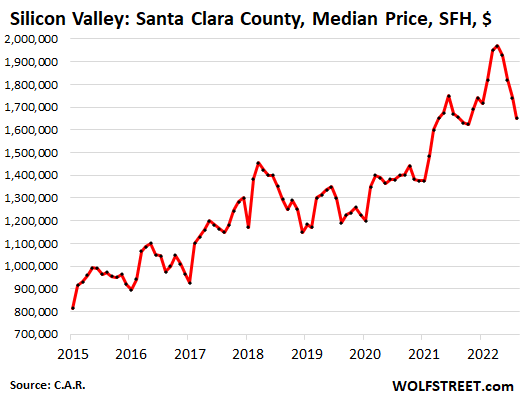
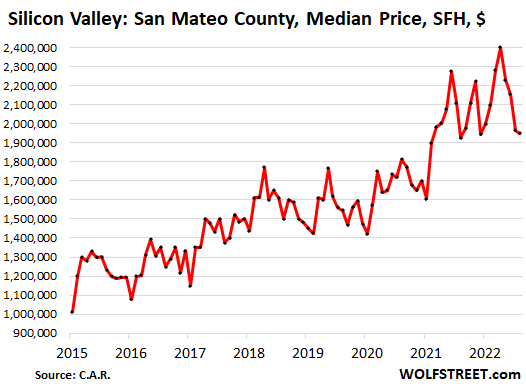
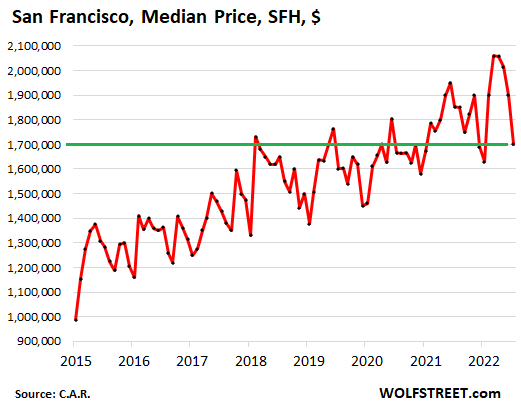
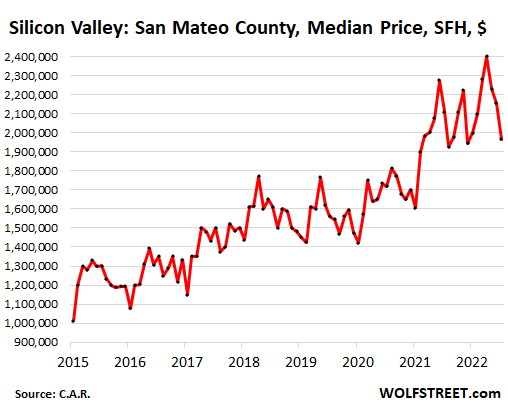
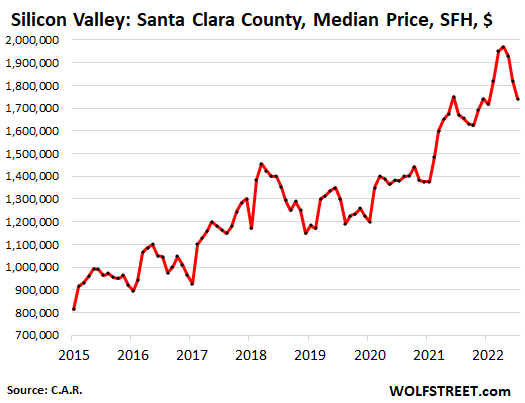
San Francisco & Silicon Valley Housing Markets Puke Huge Price Drops, as Startups, Crypto, Tech, Social Media Make Total Mess

THE WOLF STREET REPORT: The Price of Easy Money Now Coming Due
The Crazy Stuff & Asset Prices that arose during Easy Money are coming unglued as Easy Money ended.
Enjoy reading WOLF STREET and want to support it? You can donate. I appreciate it immensely. Click on the beer and iced-tea mug to find out how:

Would you like to be notified via email
... more
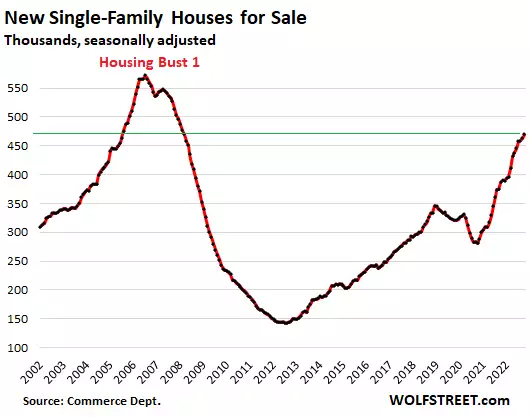
Starting to Be Housing Bust 2 for Homebuilders & New Single-Family Houses
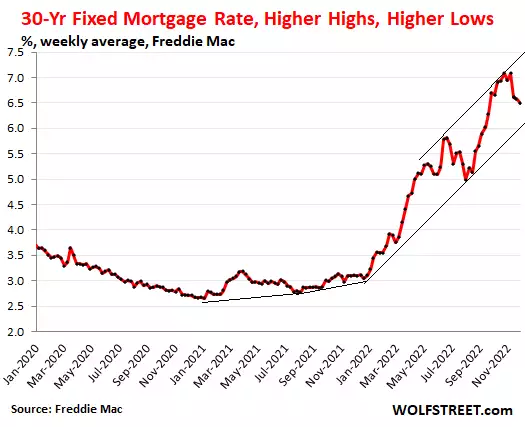
Drop in 10-Year Treasury Yield & Mortgage Rates Is Just Another Bear-Market Rally. Longer Uptrend in Yields Is Intact, with Higher Highs and Higher Lows
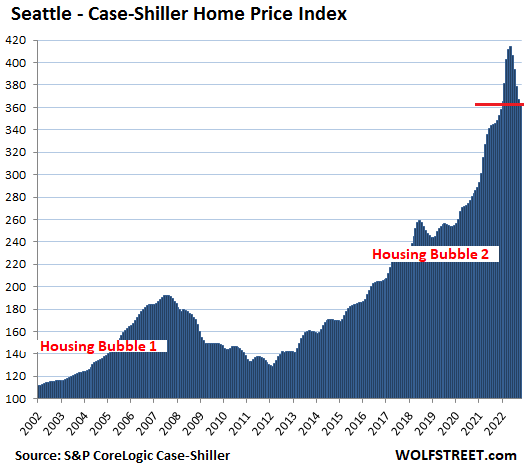
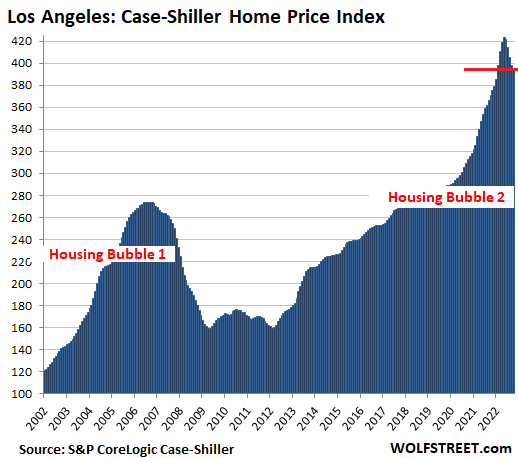
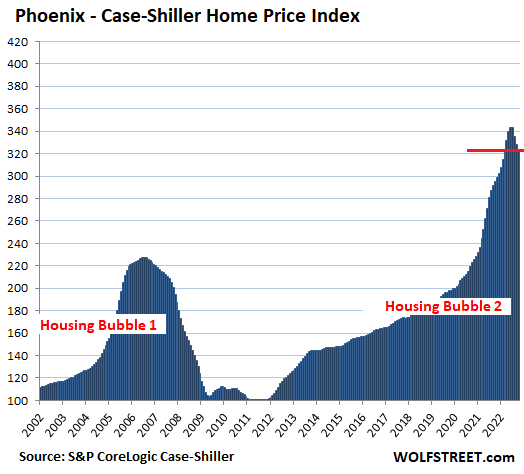
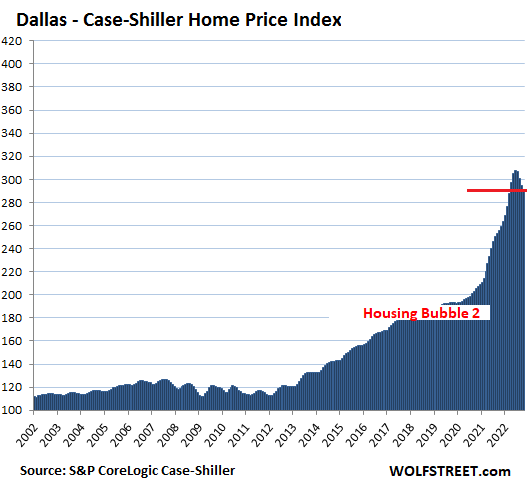
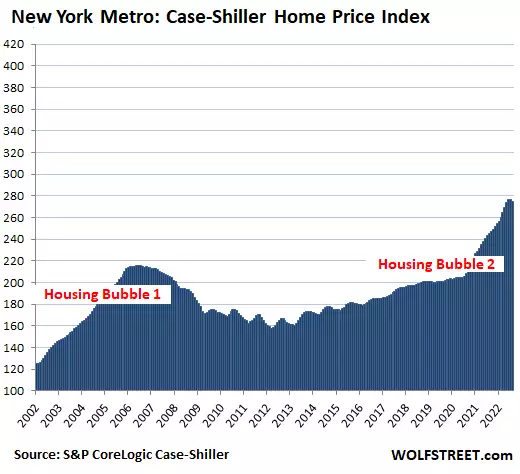
The Most Splendid Housing Bubbles in America, November Update: Deflating Everywhere, Fastest in San Francisco & Seattle. Phoenix & Dallas Roll Over Too
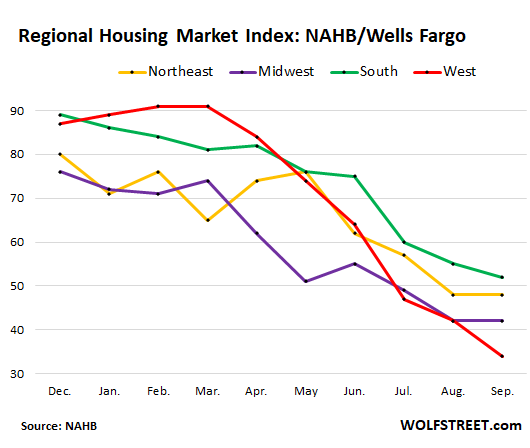
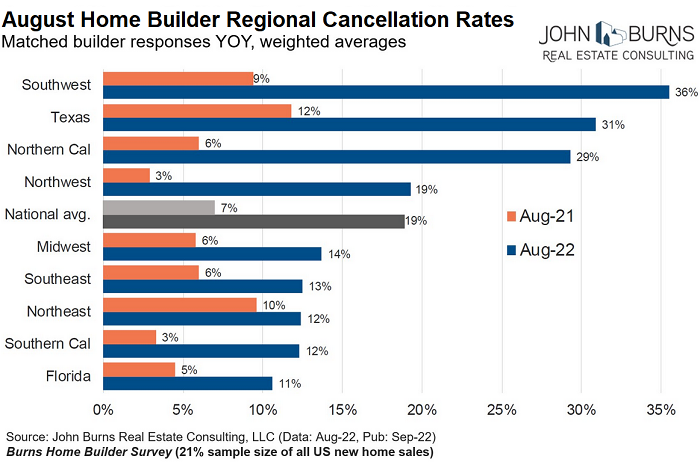
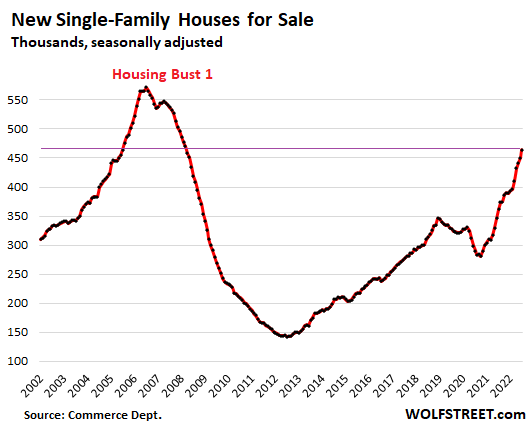
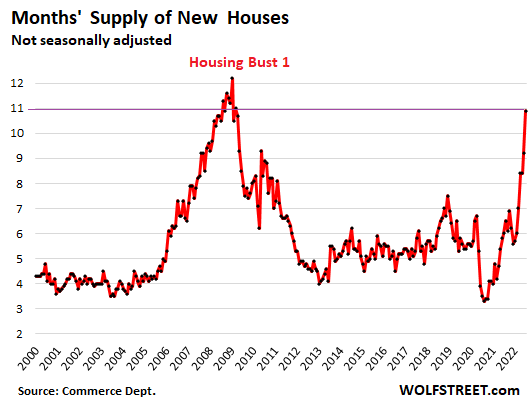
Massive Cancellations Make Mess of Already Low New-House Sales. Inventory Glut at Deep Housing Bust 1 Level. Buyer Traffic Plunges
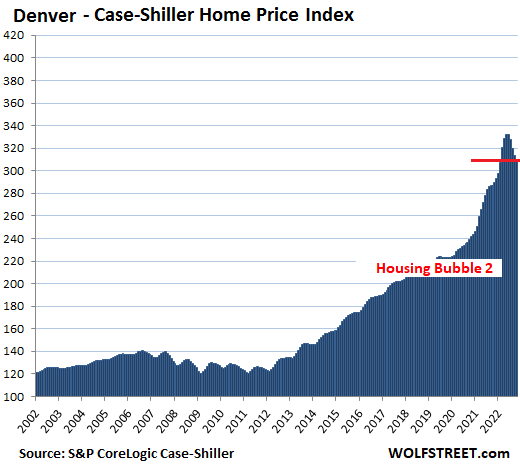
The Most Splendid Housing Bubbles in America: Biggest Price Drops since Housing Bust 1. Record Plunge in Seattle (-3.9%), Near-Record in San Francisco (-4.3%) & Denver. Drops Spread Across the US
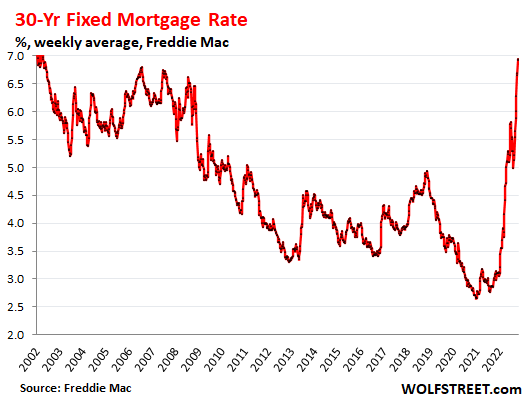
Mortgage Bankers Predict Mortgage Rates to Drop to 5.4% by End of 2023. A Year Ago, They Forecast 4% by Now, but Now We’re at 7%. Wishful Thinking by Crushed Mortgage Lenders?
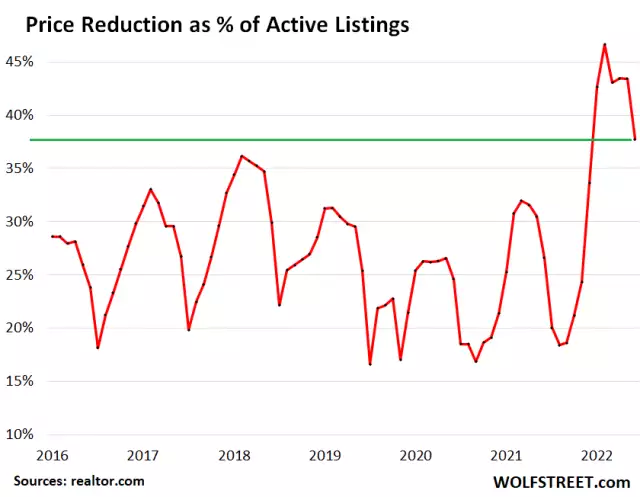
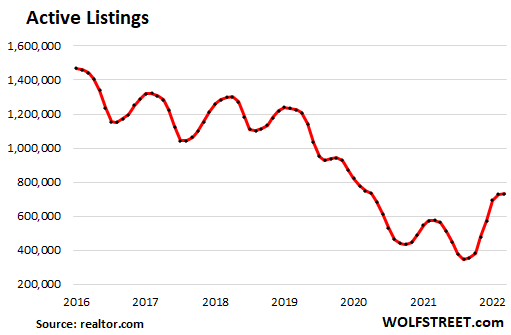
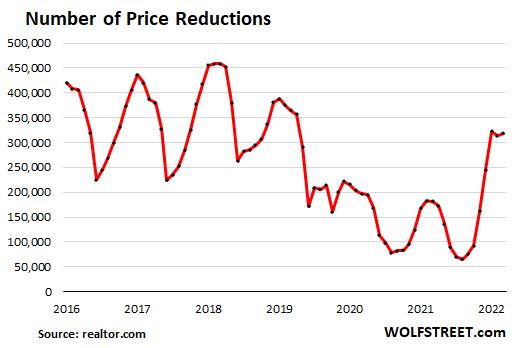
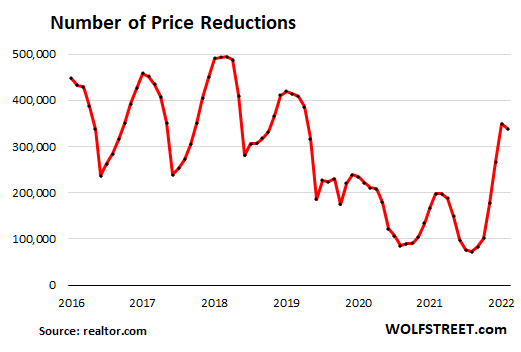
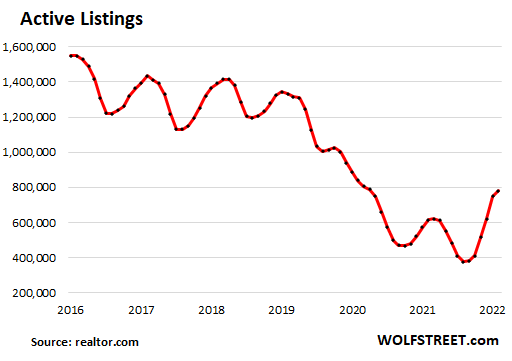
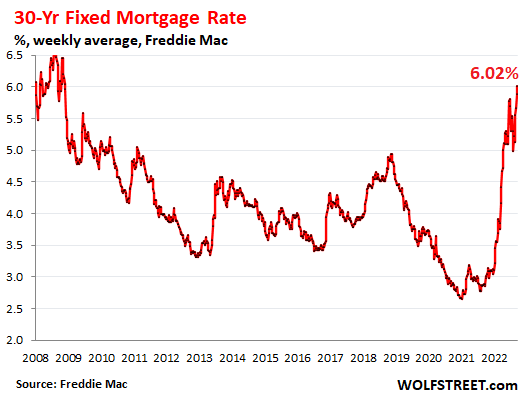
Housing Bubble Woes: Home Sales Plunge, Prices Drop 7% in 3 Months, Price Reductions Surge. Mortgage Rates Spike
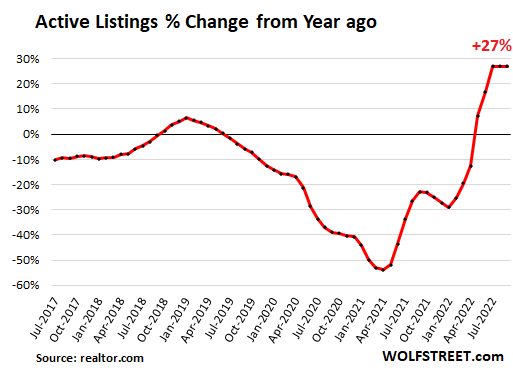
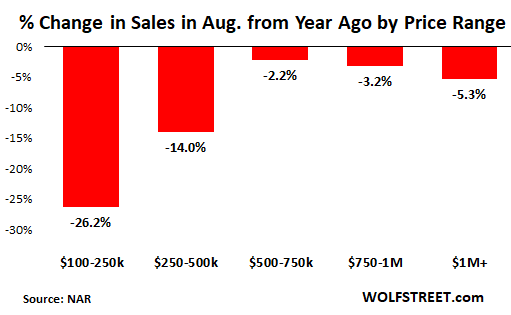
Investors are also pulling back.
By Wolf Richter for WOLF STREET.
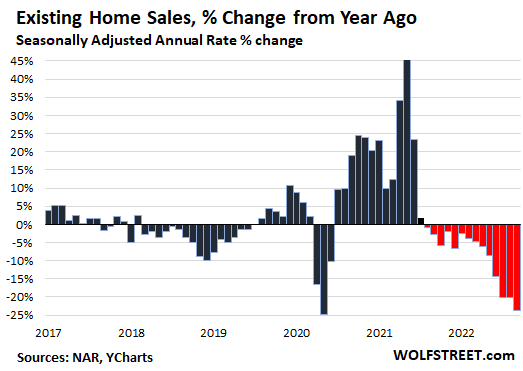
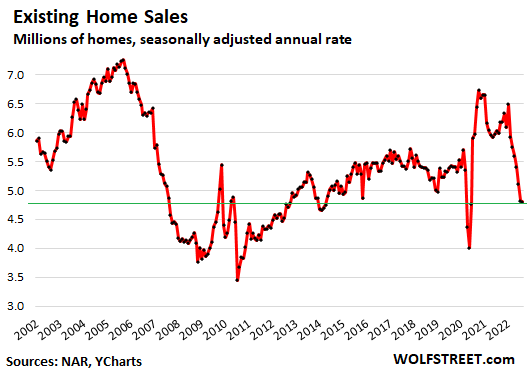
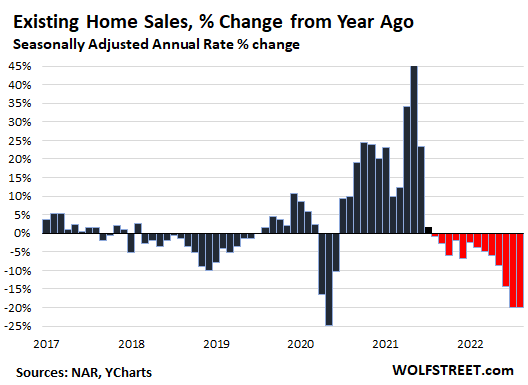
Sales of all types of previously owned homes – houses, condos, and co-ops – fell for the eighth month in a row, by 1.5% in September from August, to a seasonally adjusted annual rate of sales of 4.71 million homes, according to the National Association of Realtors in its report. Compared to the peak in October 2020, sales were down 30%.
Beyond the two lockdown months of April and May 2020,
... more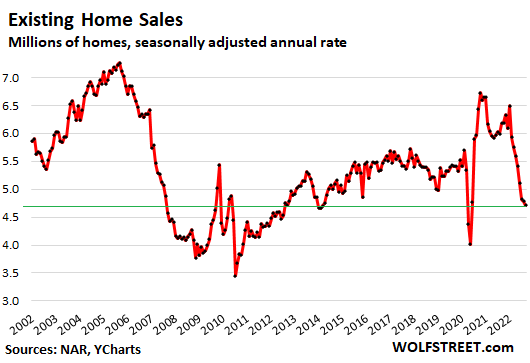
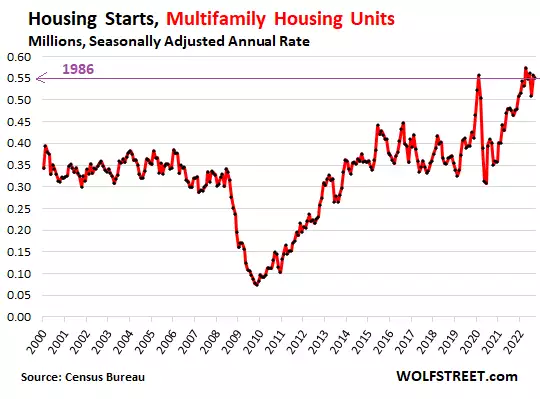
Boom v. Bust: Construction Starts of Multifamily Buildings v. Single-Family Houses
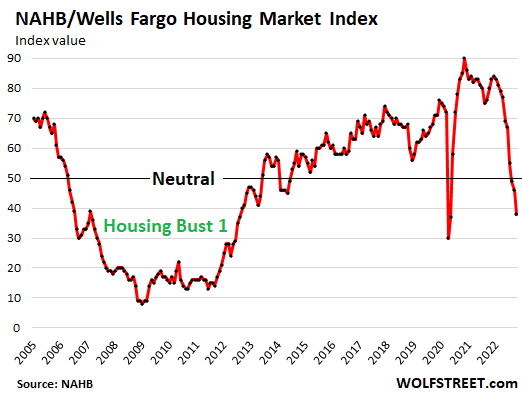
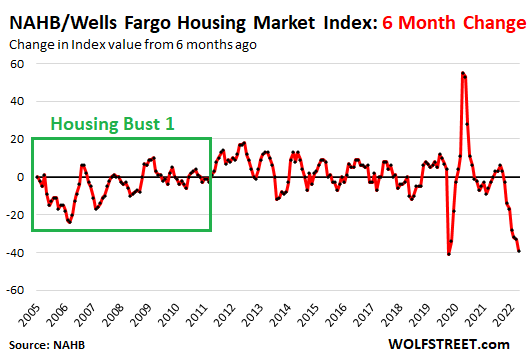
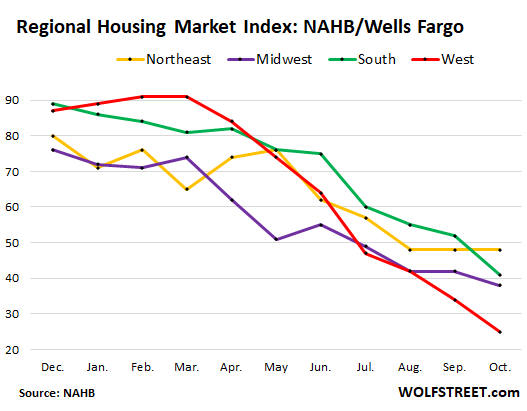
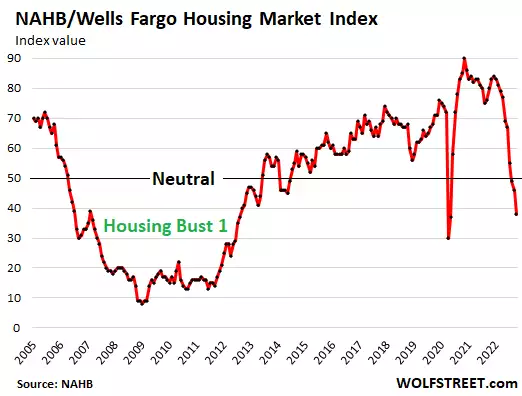
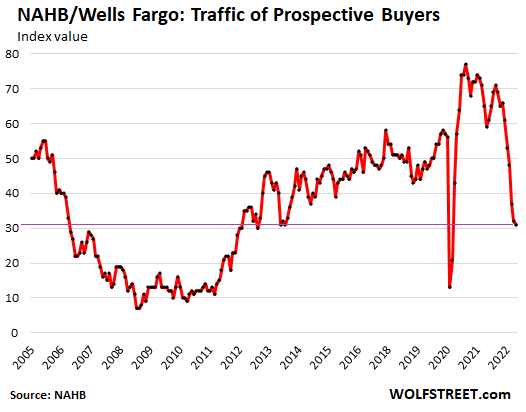
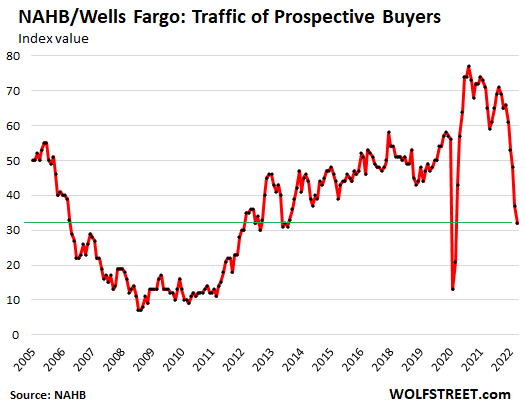
Housing Bubble Woes: Plunge in Buyer Traffic & Homebuilder Confidence a Lot Faster than During Housing Bust 1
Holy-moly mortgage rates of 7% slash demand for new houses due to super-inflated prices, but prices are now coming down.
By Wolf Richter for WOLF STREET.
Traffic of prospective buyers of new single-family houses plunged to the lowest since 2012, excluding the two lockdown months April and May, and is now approaching even the levels of those two lockdown months, according to data today from the National Association of Home Builders.
The NAHB index for traffic of
... more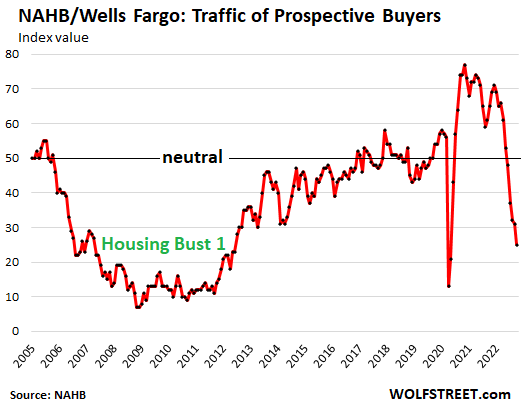
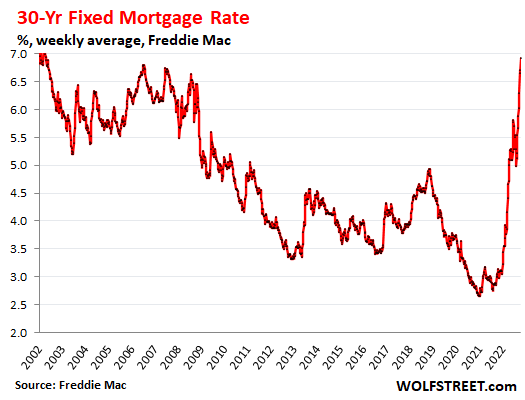
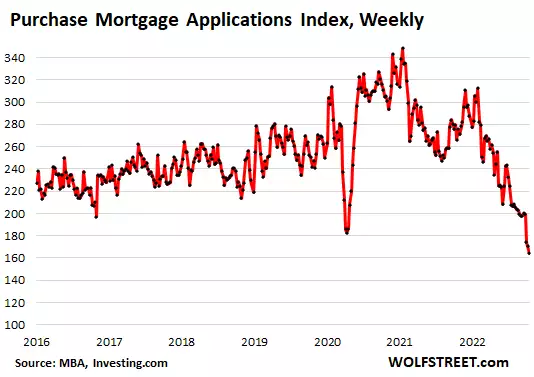
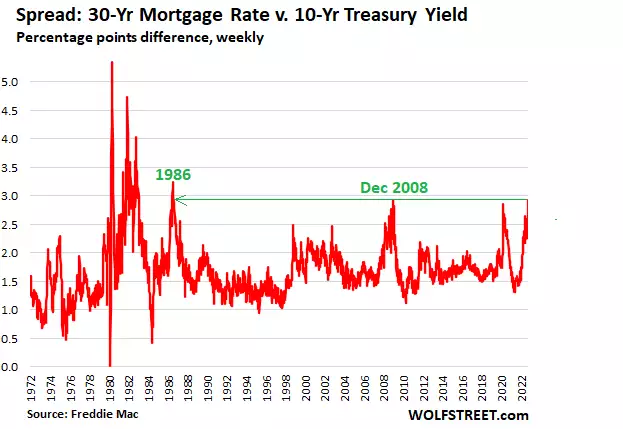
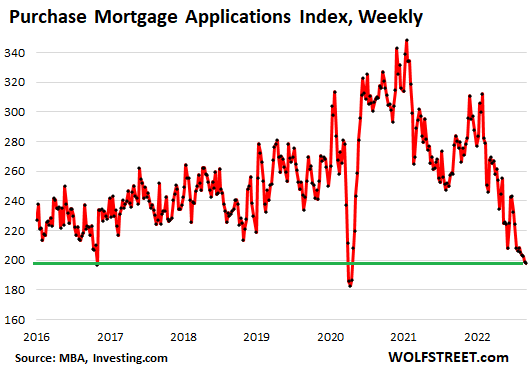
Housing Bubble Woes: Mortgage Demand Plunges, Rates Near 7%, Spread Between Mortgage Rate & 10-Year Treasury Yield Blows Out Most since Dec. 2008 and 1986
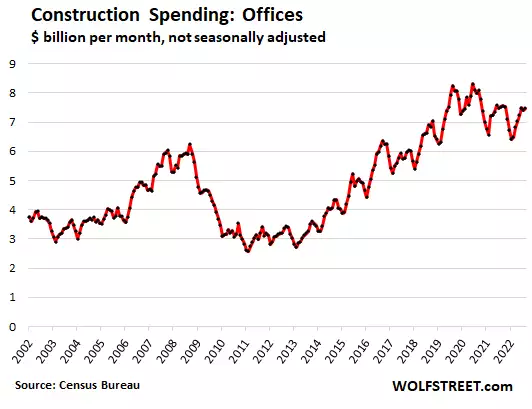
Construction Spending Ticks up, Non-Residential Hits Record, Residential Stalls after Blistering Boom
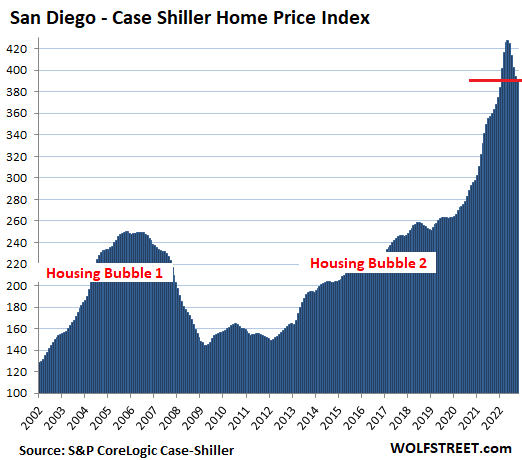
The Most Splendid Housing Bubbles in America: Price Drops Spread across US. Steepest Monthly Plunges since Housing Bust 1 in San Francisco -3.5%, Seattle -3.1%, San Diego -2.5%
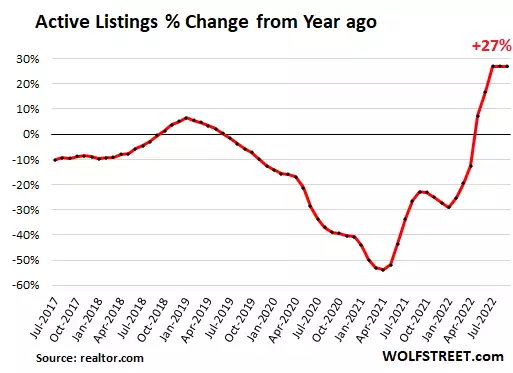
Housing Bubble Woes: Home Prices Drop 3.5%, Steepest Monthly Drop since Jan. 2016. Sales, already at Lockdown Levels, Drop Further. Active Listings Rise Further
But these sales happened during the “Fed pivot” fantasy that pushed mortgage rates down to 5%. Now mortgage rates are near 6.5%.
By Wolf Richter for WOLF STREET.
In July and through mid-August, mortgage rates fell sharply from the 6%-range in mid-June, on the widely propagated fantasy of a Fed “pivot” on rate hikes. By mid-August, the average 30-year fixed mortgage rate was down to 5%. Yesterday, they were at 6.47%. But the brief interlude of dropping mortgage
... more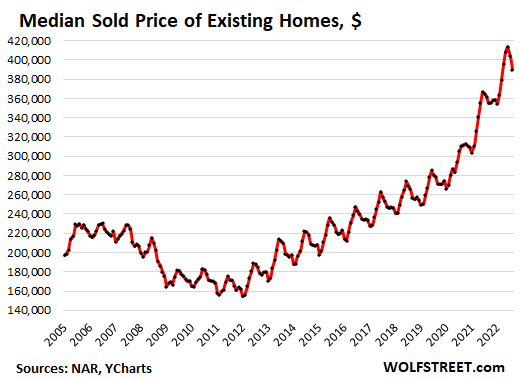
Housing Bubble Woes: Home Builders Cut Prices, Pile on Incentives, amid Plunging Traffic of Buyers, Spiking Cancellations, Holy-Moly Mortgage Rates
To prop up sales, 24% of home builders cut prices, others tried mortgage-rate buydowns or other incentives.
By Wolf Richter for WOLF STREET.
“Buyer traffic is weak in many markets as more consumers remain on the sidelines due to high mortgage rates and home prices that are putting a new home purchase out of financial reach for many households,” according to the National Association of Home Builders this morning regarding its survey of home builders.
Incentives:
... more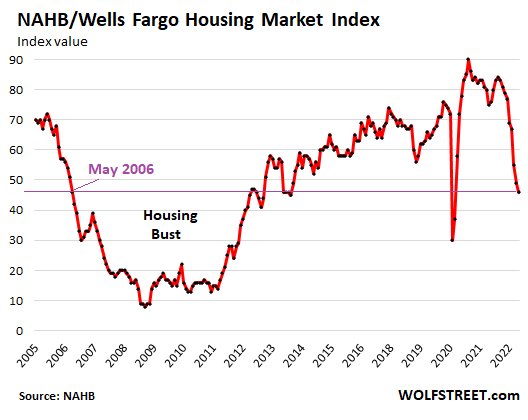
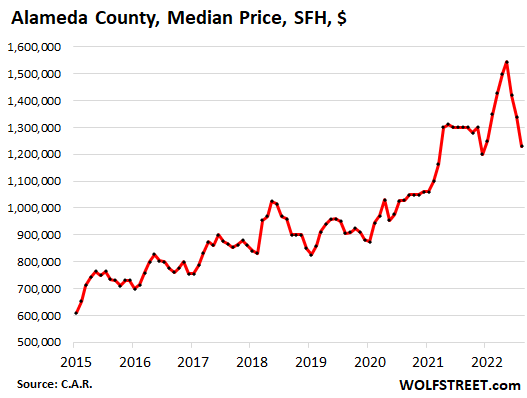
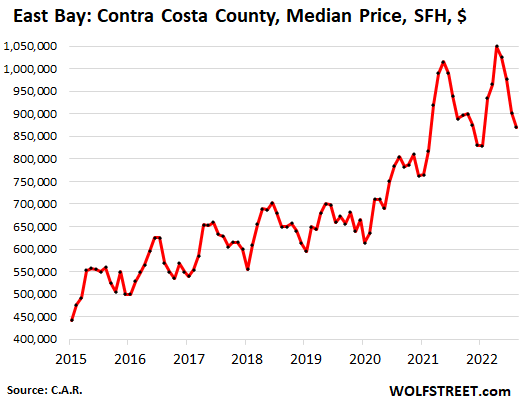
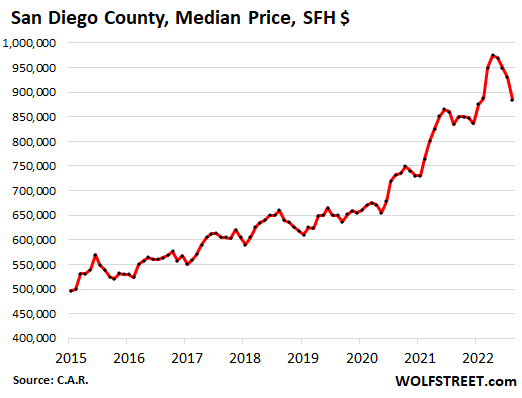
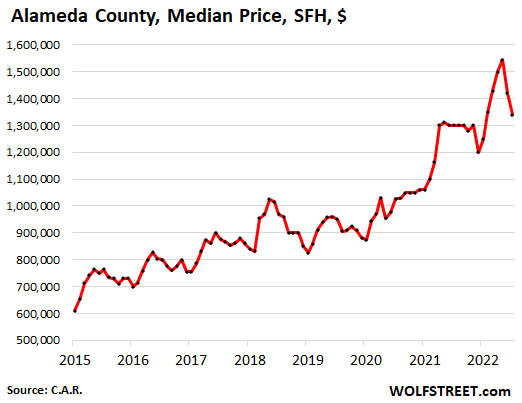
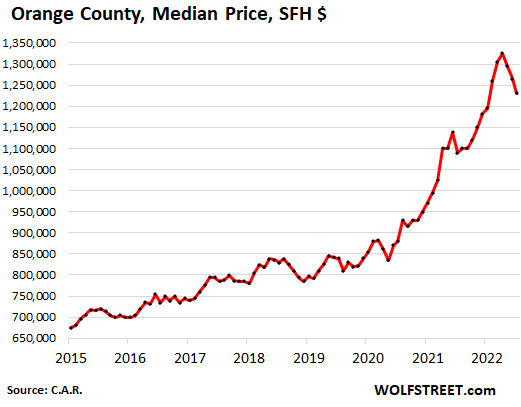
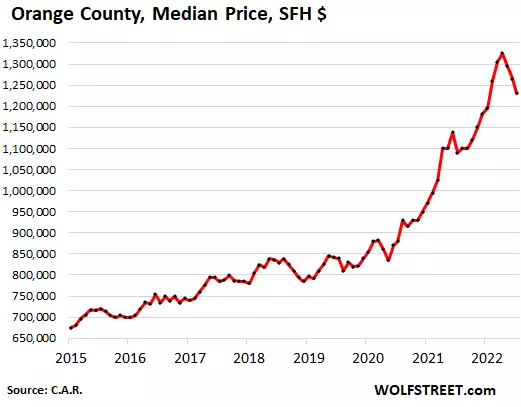
California Housing Market: Dismal Sales, Prices Sag in San Francisco (-20% fr. peak), Silicon Valley, San Diego, Orange County…
And this was during the summer rally as mortgage rates dropped to 5%, stocks bounced, the Fed “pivoted,” and the Good Times started all over again.
By Wolf Richter for WOLF STREET.
Home sales that closed in August were made somewhere from a few days to a couple of months before they closed – so roughly around and before the peak of the summer bear-market rally in mortgage rates and stocks that started in mid-June and ended in mid-August.
By mid-June, the
... more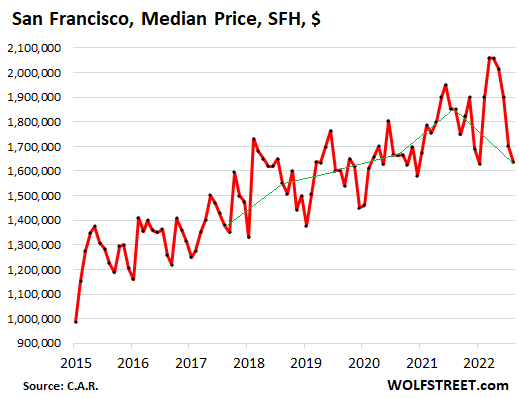
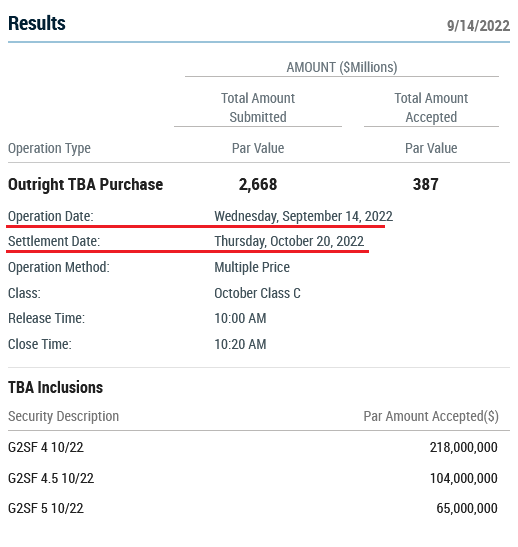
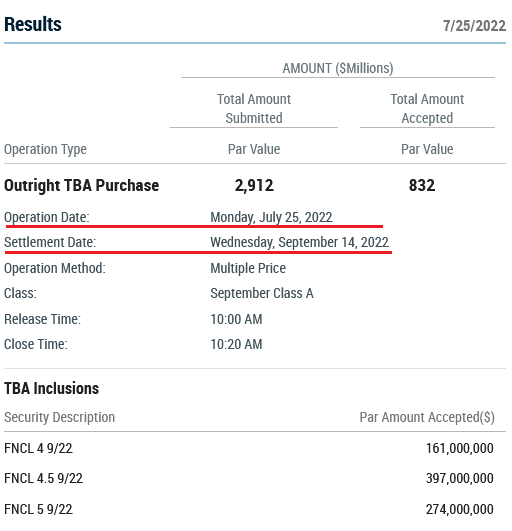
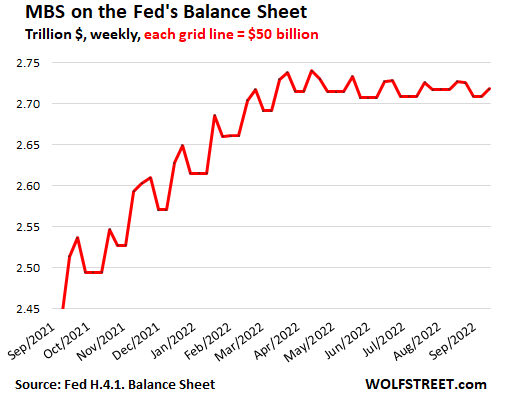
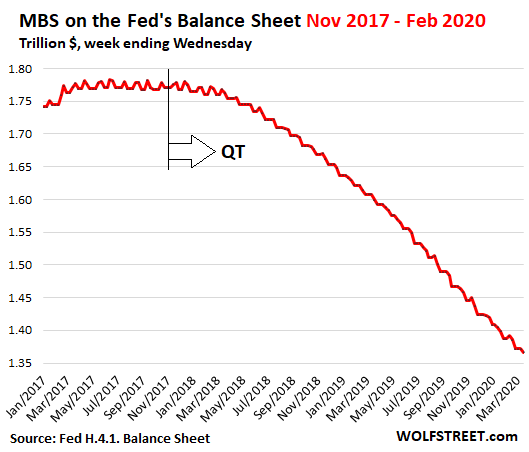
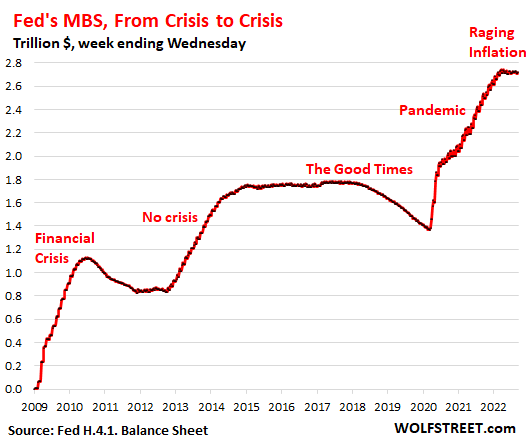
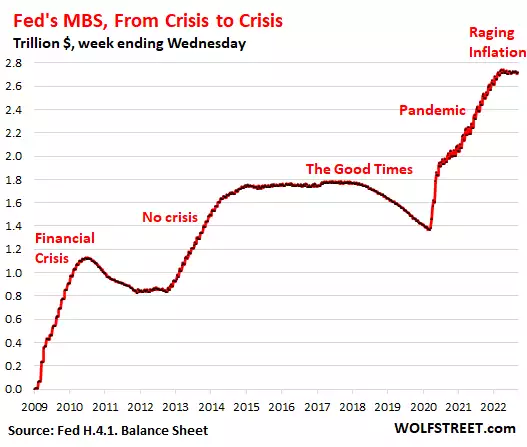
The Fed Stopped Buying MBS Today.
The purpose of MBS purchases was to repress mortgage rates and inflate home prices. That process has already started to reverse.
By Wolf Richter for WOLF STREET.
A date for history: Today, September 15, the Fed stopped buying mortgage-backed securities altogether. It had been tapering its purchases since late last year. Since June, when the phase-in of QT started, it still purchased MBS to replace some of the pass-through principal payments from mortgage payoffs and mortgage
... more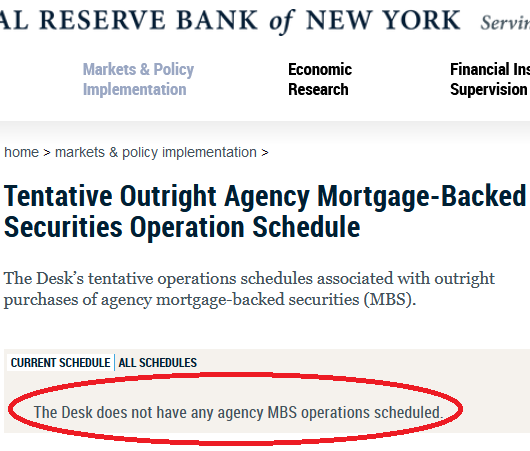
Boots-on-the-Ground Observations by 21 Home Builders about the Housing Market They’re Facing

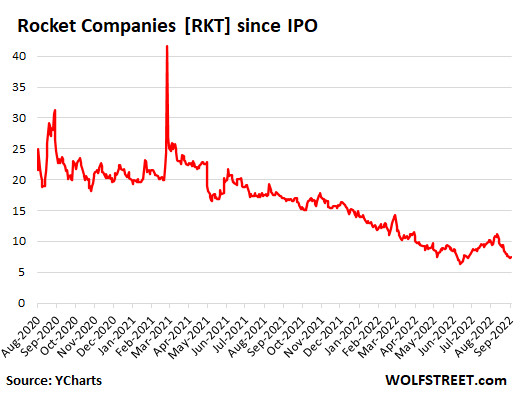
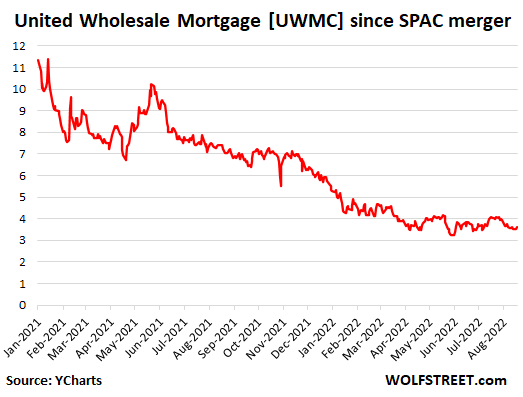
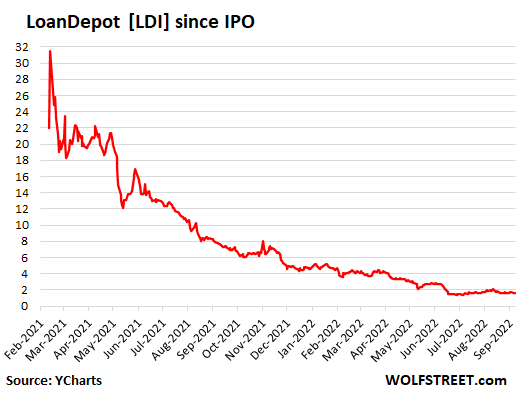
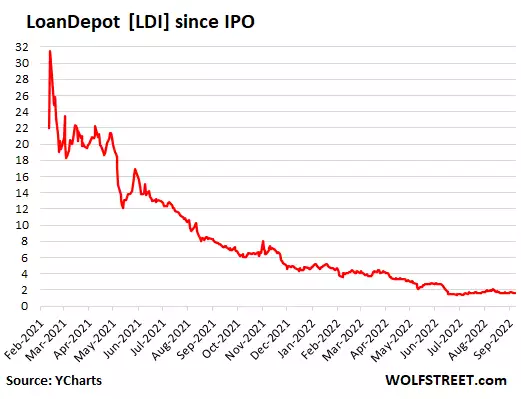
Mortgage Lender Woes
It’s not that mortgages are bad, it’s that mortgage volume collapsed. And the stocks of the biggest mortgage lenders collapsed after IPO or SPAC merger.
By Wolf Richter for WOLF STREET.
The latest entry in the long litany of mortgage-lender layoffs is Citibank, which let go some people in its mortgage unit. Well Fargo, JPMorgan Chase, and numerous other banks, along with the non-bank mortgage lenders, have laid off staff starting late last year.
The biggest
... more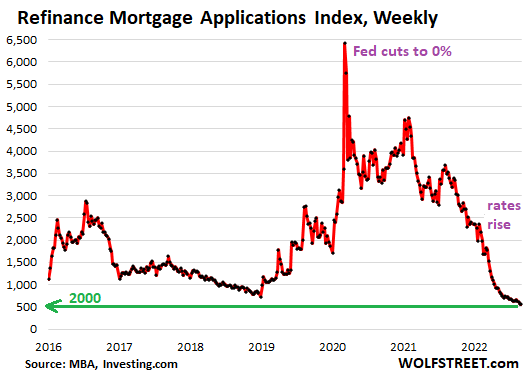
The Most Splendid Housing Bubbles in America, August Update: First Price Drops Appear, All in the West
Sales of New Houses Collapse (in the West by 50%!) Inventories & Supply Spike to High Heaven, Worst since Peak of Housing Bust 1
Forget “housing shortage.” It’s about crazy prices: For sales to revive at these mortgage rates, prices have got to come down a lot — and they’re starting to.
By Wolf Richter for WOLF STREET.
The plunge in home sales is just stunning. Sales of new single-family houses collapsed by 12.6% in July from the already beaten-down levels in June, and by nearly 30% from July last year, to a seasonally adjusted annual rate of 511,000 houses, the lowest since January 2016,
... more
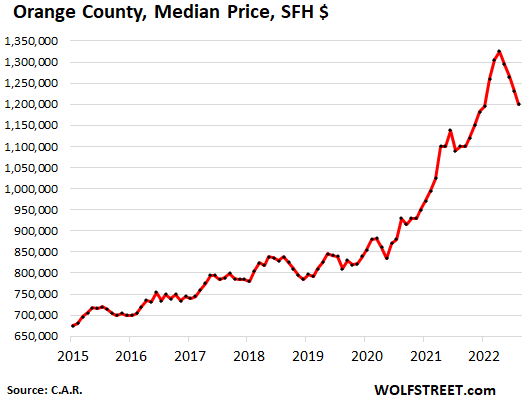
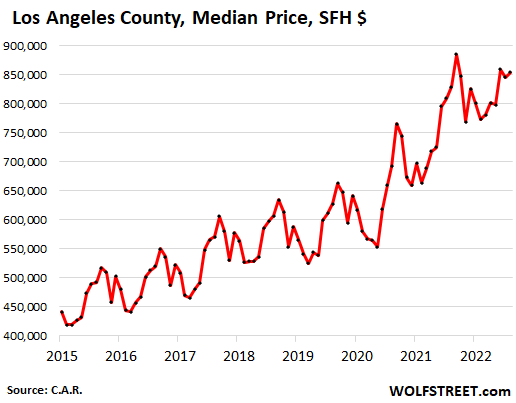
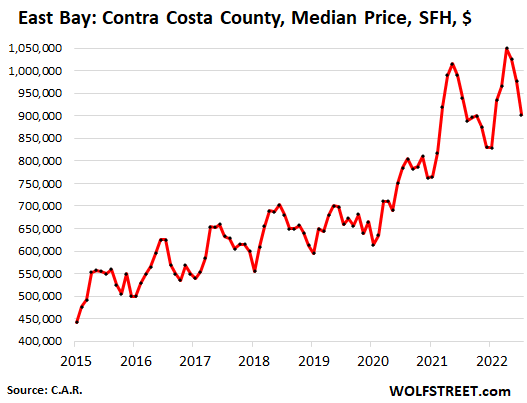
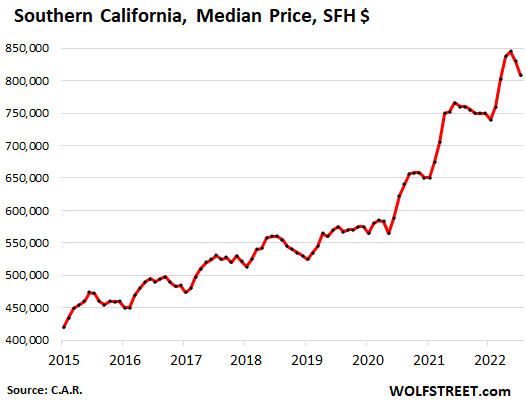
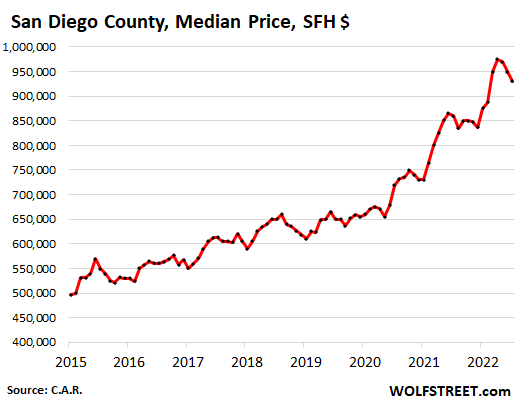
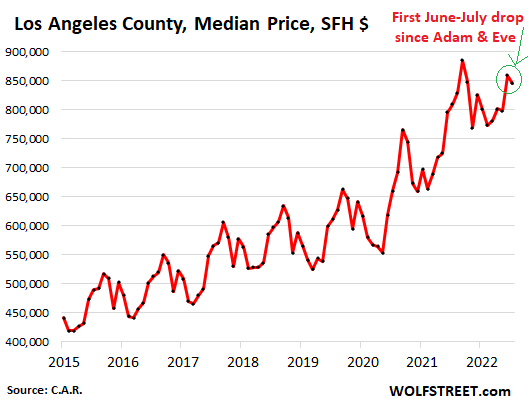
California Housing Market Pukes: As Sales Collapse (San Diego County -41%), Prices Begin to Swoon
San Francisco & Silicon Valley lead. Southern California is catching up. In Los Angeles County, prices fell in July from June for the first since Adam and Eve.
By Wolf Richter for WOLF STREET.
It’s peak home-buying season in California, but sky-high home prices, holy-moly mortgage rates, the collapse of cryptos, the vanishing DeFi, and the implosion of tech startups, SPACs, and IPOs, all of which are crucial to the wealth, or perceived wealth, of many Californians,
... more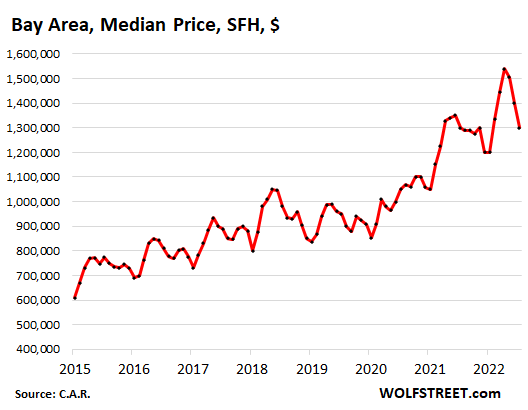
Housing Bubble Getting Ready to Pop: The Big Boys Leave, Waiting for Reset

THE WOLF STREET REPORT: Housing Bubble Getting Ready to Pop – The Big Boys Leave, Waiting for Reset
Biggest investors in single-family houses: “We need to be patient and allow the market to reset” (you can also download the WOLF STREET REPORT wherever you get your podcasts).
Enjoy reading WOLF STREET and want to support it? Using ad blockers – I totally get why – but want to support the site? You can donate. I appreciate it immensely. Click on the beer and iced-tea mug to find out how:
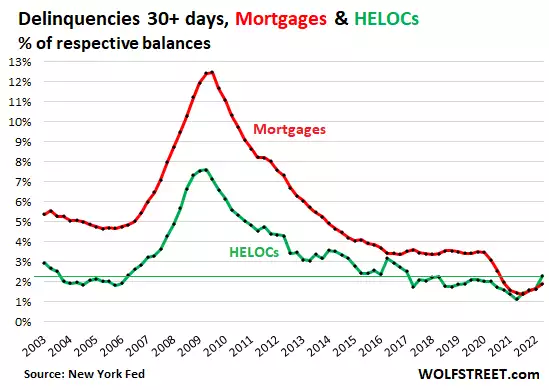
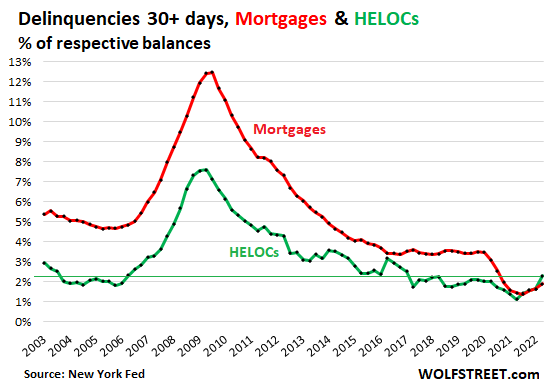
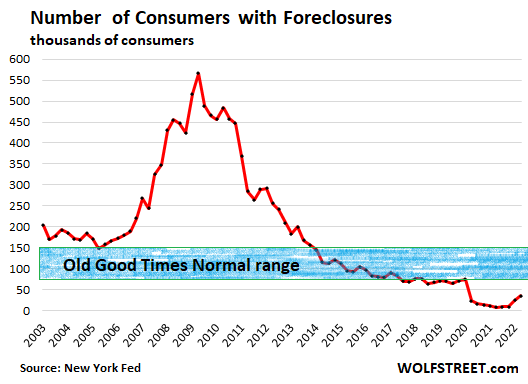
Trip Back to Reality Starts: Mortgages, HELOCs, Delinquencies, and Foreclosures in Q2