Seattle Bubble


So… what the heck is going on with the Seattle housing market?
Since we’ve been gone for so long, I thought I’d start back up with somewhat of an overview post. Let’s just take a look at what’s going on in the Seattle-area (King County) housing market recently.
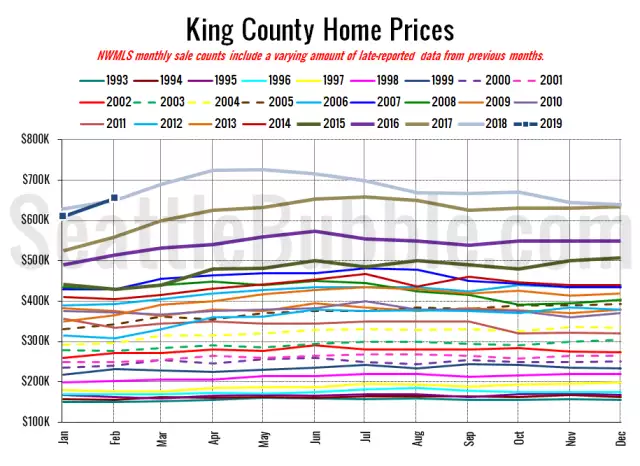
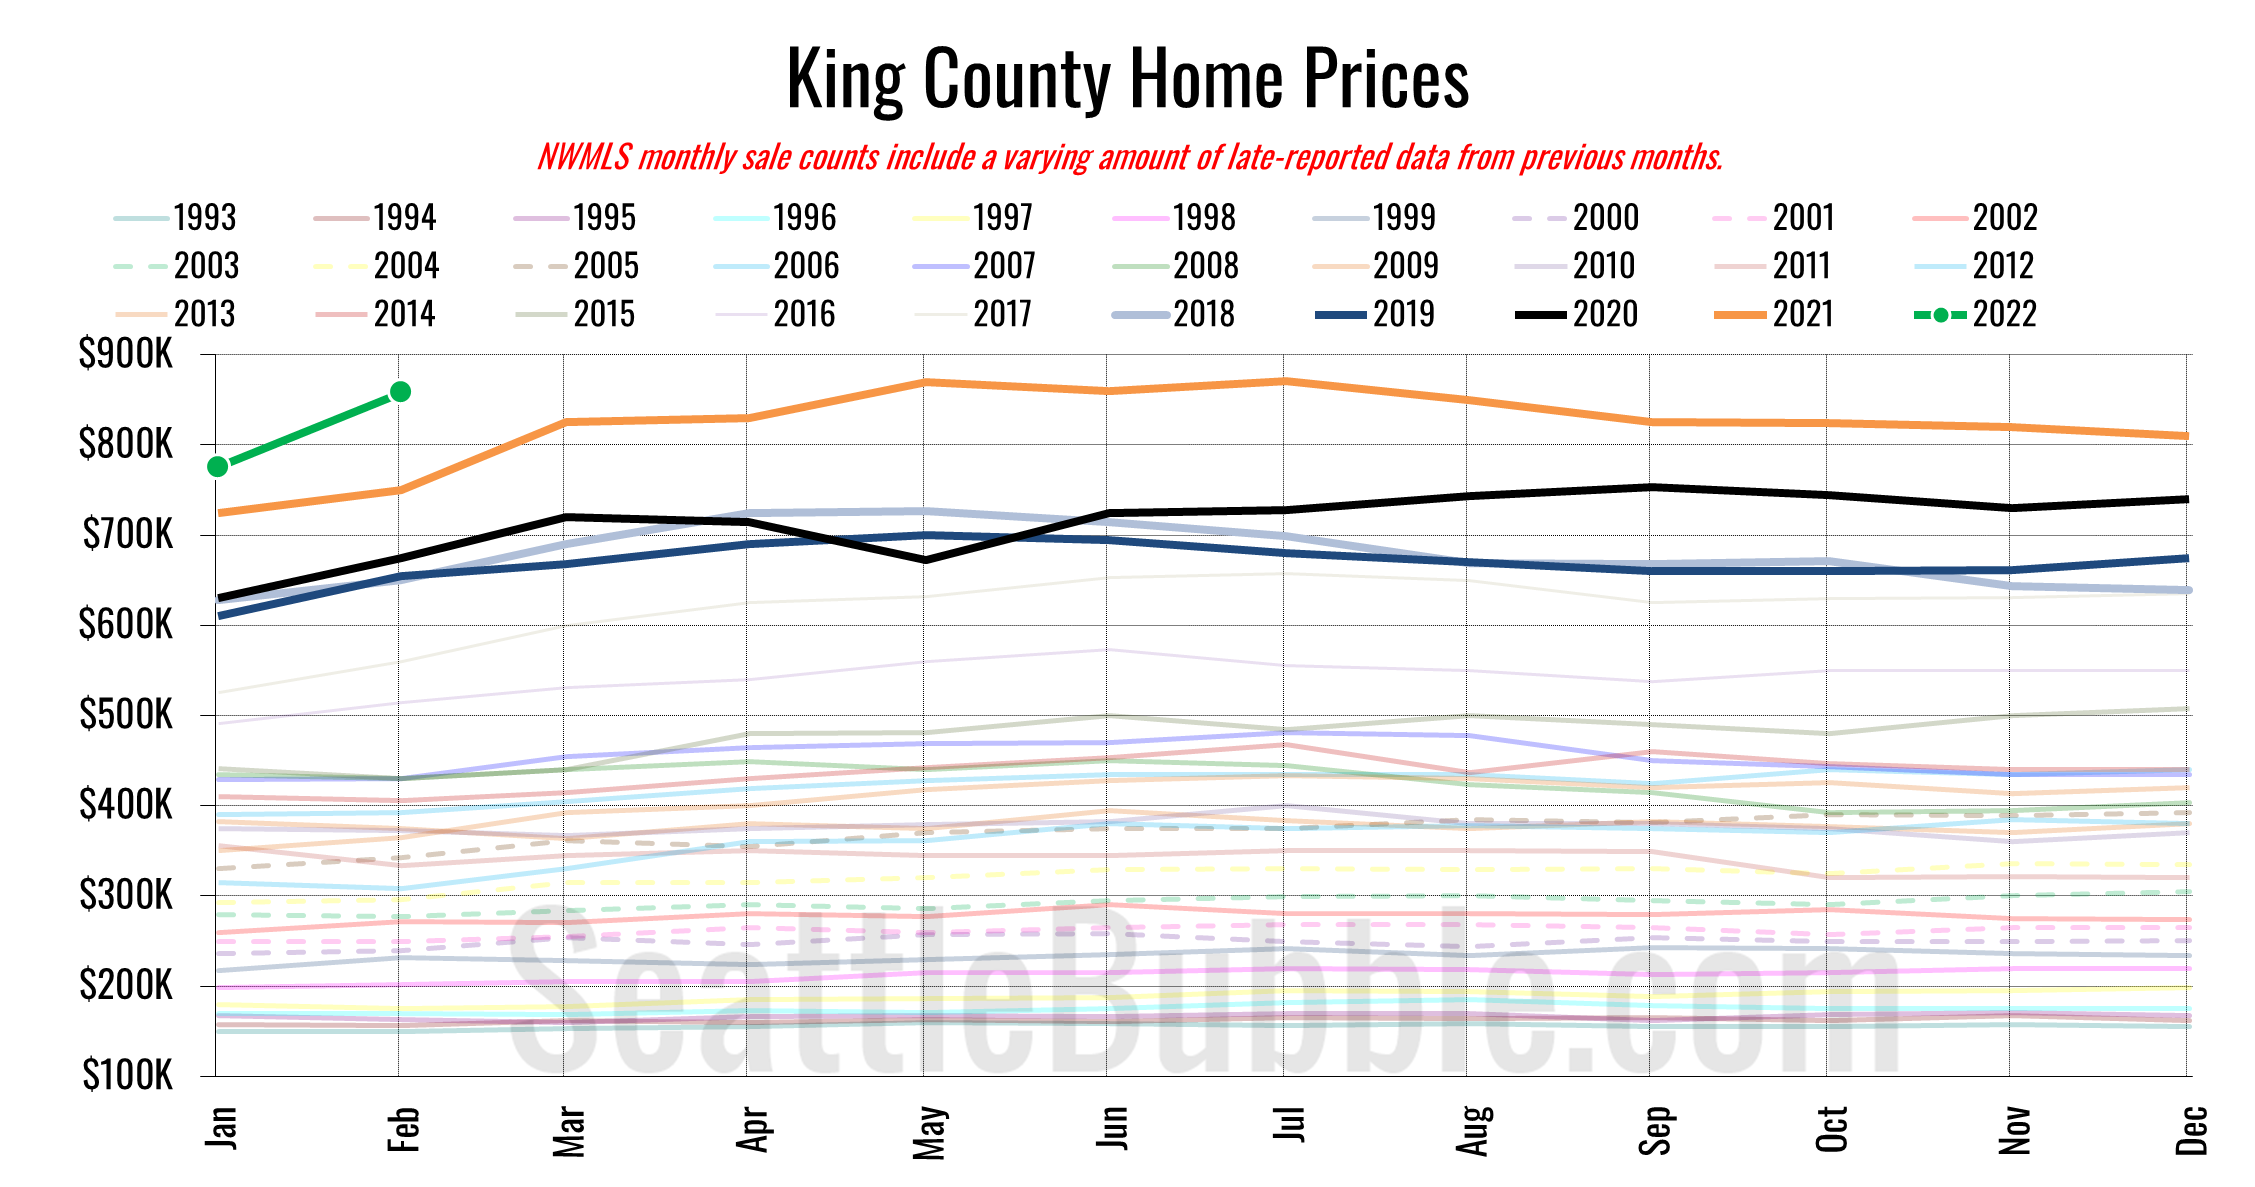
One of the biggest topics on everybody’s mind lately is home prices, so let’s start there. The median price of single-family homes sold in King County in February was $857,750, up 14% from a year earlier.


Eliminating single-family zoning is a good idea, and Christopher Kirk’s Seattle Times editorial is a steaming pile of garbage
An editorial by Christopher Kirk in the Seattle Times yesterday was so stupid I had no choice but to finally come back here and respond.
Here's the link: Statewide rezoning of single-family neighborhoods is a terrible idea
Now, before we start it's worth noting that this piece is described as a "Special to The Times" and the author is not a journalist. He's not an economist,
... more
Cleaning House, Working on Updates
Just a quick note to let you know that I'm working on cleaning house here…
The post Cleaning House, Working on Updates appeared first on Seattle Bubble.
Around the Sound: Still a dismal market for buyers everywhere
Let's take a look at our stats for the local regions outside of the King/Snohomish core. Here's your October update to our "Around the Sound" statistics for Pierce, Kitsap, Thurston, Island, Skagit, and Whatcom counties…
The post Around the Sound: Still a dismal market for buyers everywhere appeared first on Seattle
... more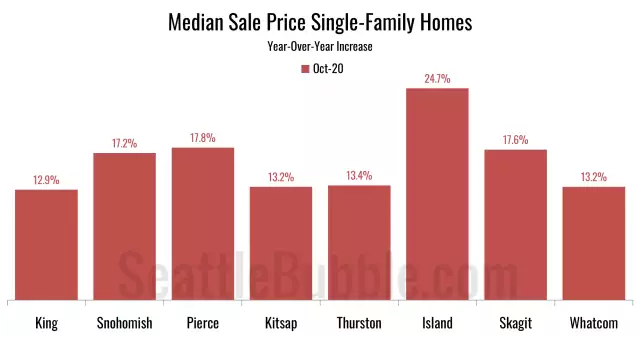
NWMLS: Strongest October ever for closed sales
October market data from the NWMLS is available. Here's what happened last month in the Seattle-area housing market: Home prices and pending sales fell slightly, but closed sales rose to the highest level ever seen during an October—over 3,000 sales.
The post NWMLS: Strongest October ever for closed sales appeared first on Seattle
... more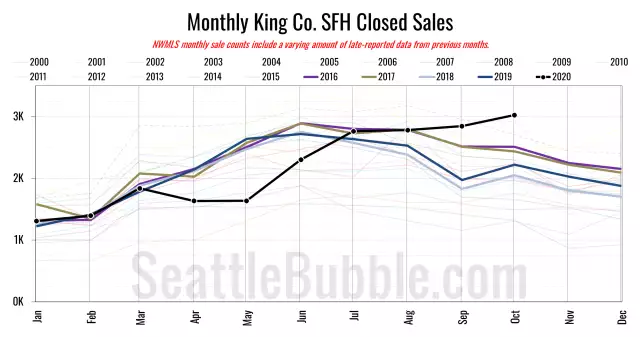
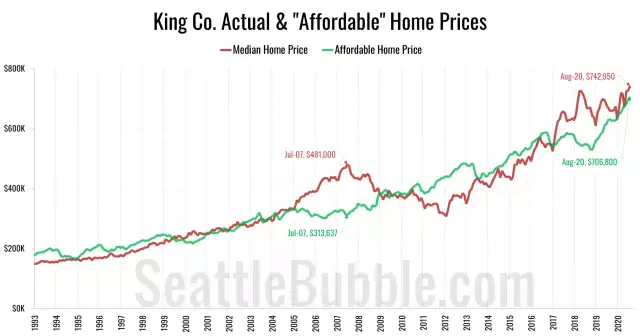
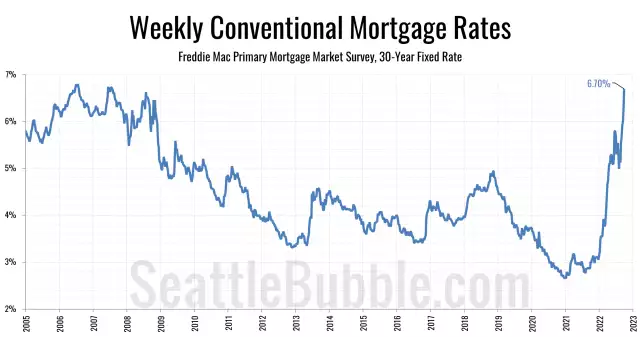
Plunging mortgage rates held off a Seattle home price crash
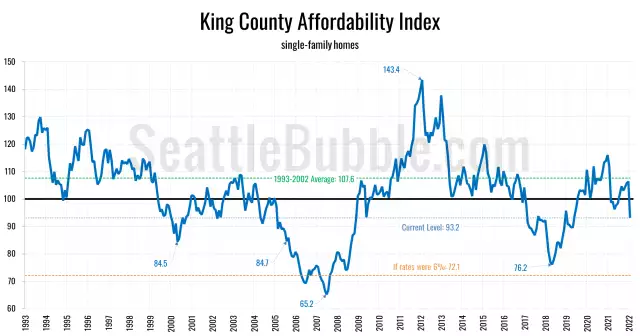
The article provides an analysis of the affordability index for various counties in the Puget Sound area in August 2020. The affordability index is a measure that compares the monthly costs of a median-priced home to the median household income in the area. An index level above 100 indicates that the monthly payment on a median-priced home costs less than 30% of the median household income, while an index below 100 means that the monthly payment is over 30% of the median income.
According to the data
... more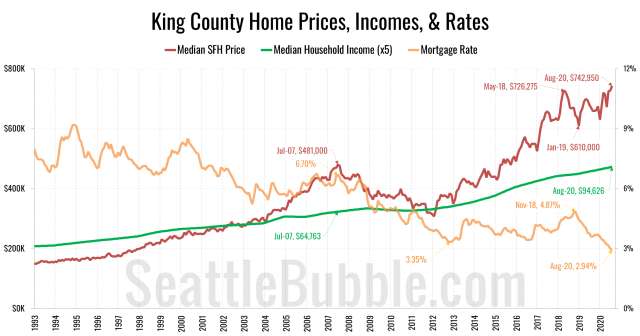
NWMLS: Pending sales hit an all-time high in August
August market stats were published by the NWMLS on Friday before the holiday weekend. The King County median price of single-family homes rose over 10 percent year-over-year for the first time since May of 2018. Inventory is way down from a year ago, and pending sales climbed to an all-time record high…
The post NWMLS: Pending sales hit an all-time high in August
... more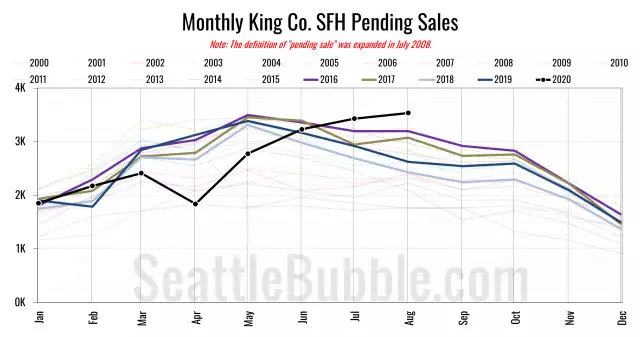
August stats preview: Plenty of demand, still so little supply
As we're getting back into the swing of things, let's check out the housing stats for the recently-completed month of August…
The post August stats preview: Plenty of demand, still so little supply appeared first on Seattle Bubble.
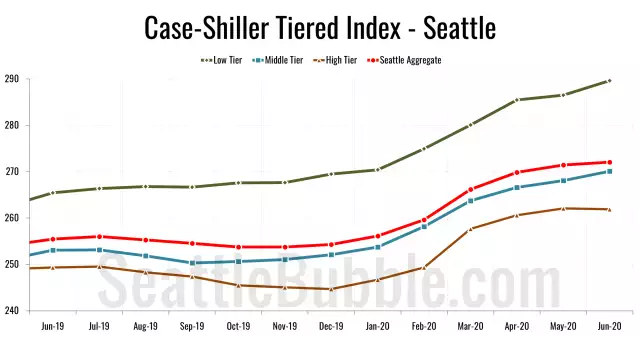
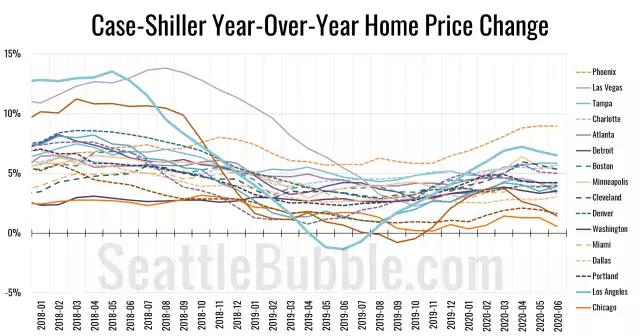
Case-Shiller Tiers: Low Tier Home Prices are Soaring
Let's check out the three price tiers for the Seattle area, as measured by Case-Shiller. Remember, Case-Shiller's "Seattle" data is based on single-family home repeat sales in King, Pierce, and Snohomish counties.
The post Case-Shiller Tiers: Low Tier Home Prices are Soaring appeared first on Seattle Bubble.
Case-Shiller: Seattle Home Prices Up 6.5% from 2019 in July
Let's catch up a bit on our Case-Shiller data. According to June data that was released this week, Seattle-area home prices were up 0.2 percent May to June and up 6.5 percent YOY…
The post Case-Shiller: Seattle Home Prices Up 6.5% from 2019 in July appeared first on Seattle Bubble.
The pandemic has sparked a massive seller’s market and big price spikes around Seattle
Okay, let's get back to the data. It's about time. Okay, it's way past time. Anyway, whatever. Here's some data. Since it's been a while, let's start with a few high-level stats from around the Puget Sound…
The post The pandemic has sparked a massive seller’s market and big price spikes around Seattle appeared first on
... more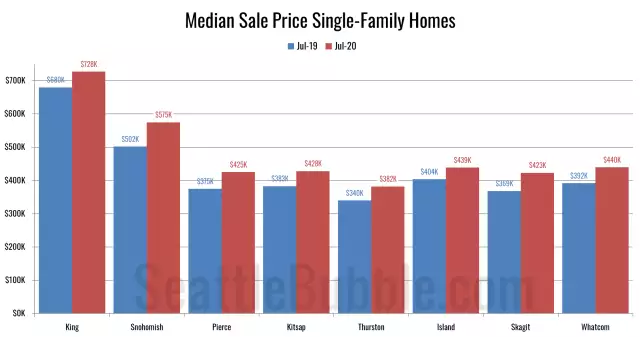
Seattle Bubble and The Tim are not dead, just in hibernation.
Hoping to come back to life soon…
The post Seattle Bubble and The Tim are not dead, just in hibernation. appeared first on Seattle Bubble.

NWMLS: New listings dry up as home prices plateau
The NWMLS published their August stats yesterday, so let's take a look at how the month shook out for the housing market.
As we mentioned in yesterday's preview post, the biggest story is a sudden, renewed shortage of inventory.
Before we get into our detailed monthly stats, here's a quick look at their press release…
The post NWMLS: New listings dry up as home prices
... more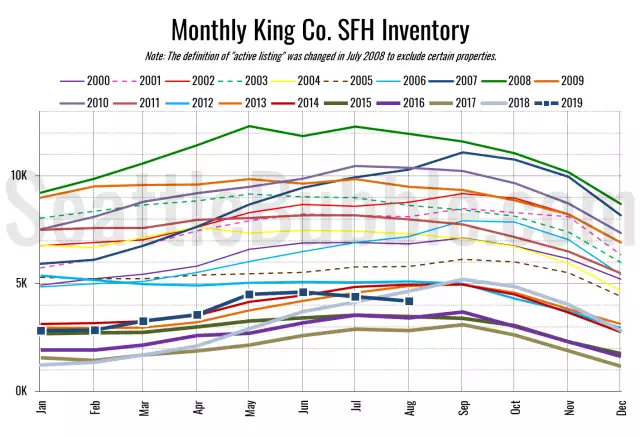
August Stats Preview: Where did the listings go?
NWMLS stats for August are due any day now, probably later today, but let's have a look at our "early" view on the August housing market stats for the Seattle area.
The biggest news: Active listings appear to be down considerably from a year ago. This is a big flip from earlier this year, when listings were way up, and definitely not great news for buyers.
The post August Stats
... more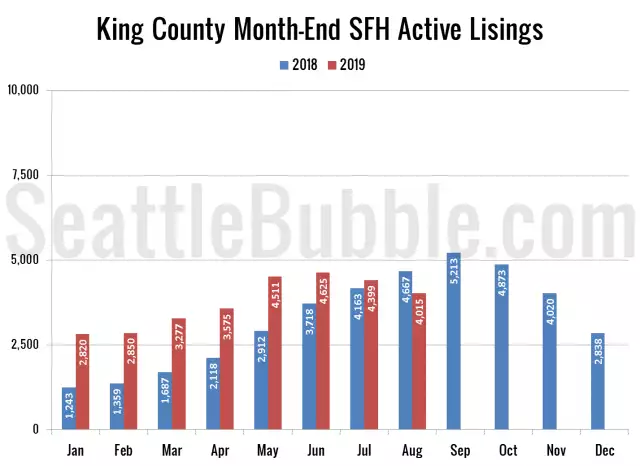
Around the Sound: King County alone in price drops and big inventory gains
I promised an updated look at June data for the outlying counties, so let's have a look at that. Here's the latest update to our "Around the Sound" statistics for King, Snohomish, Pierce, Kitsap, Thurston, Island, Skagit, and Whatcom counties.
King County is the only place where prices are declining, and it also has the largest increase in active listings compared to a year ago. On the flip side, pending sales were up the most in King County, and it had one of the smallest declines in closed sales
... more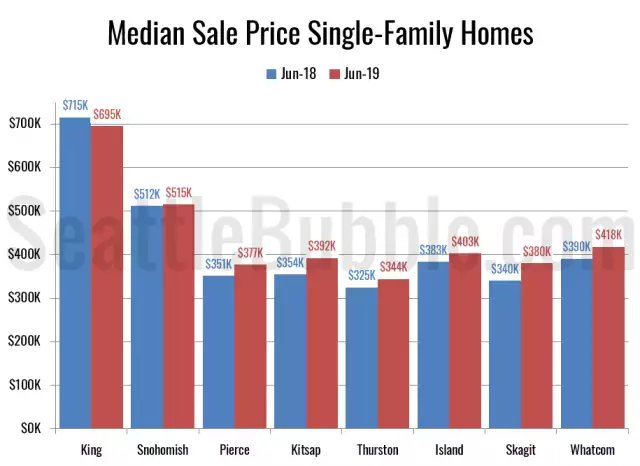
NWMLS: Home prices and sales stagnated in June
The NWMLS just published their June stats, so let's take a look at how the month shook out for the housing market. The King County median price of single-family homes was down year-over-year again in June, the fourth month in a row of declines. Inventory was up from a year ago again, but the as we mentioned in the preview post earlier this morning, the rate of increase is rapidly declining from the all-time high set in December. Closed sales were down a bit from a year earlier, while pending sales were up
... more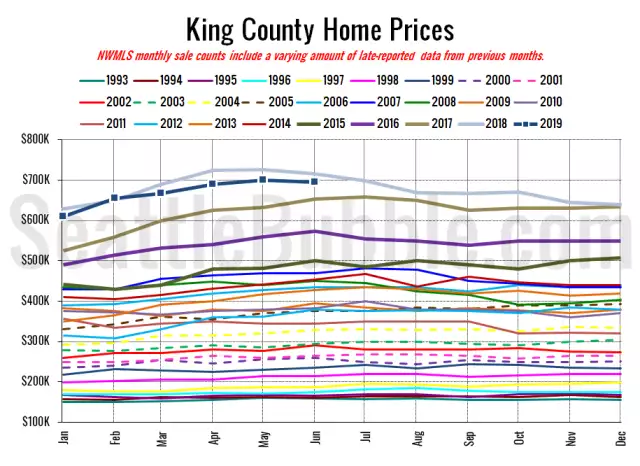
Stats Preview: Sales dipped in June as listings increase shrank further
This is the last post in today's data catch-up marathon. I'll also update a few more of the spreadsheets for members, and if the NWMLS posts their June data today I'll try to get that up as well.
For now, let's have a look at our "early" view on June stats.
In summary: Listings are still up from a year ago, but not by as much as they have been. Sales are down, but only just a bit.
The post Stats
... more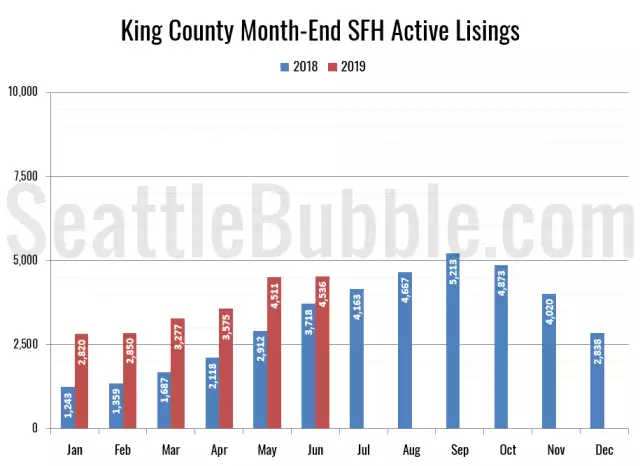
Consumer Confidence has been stagnating, and fell in June
As part of our data catch-up extravaganza, let's check in in on the latest data from the Consumer Confidence Index.
The overall Consumer Confidence Index currently sits at 121.5, down 7.5 percent in a month and down 4.4 percent from a year ago.
The post Consumer Confidence has been stagnating, and fell in June appeared first on Seattle
... more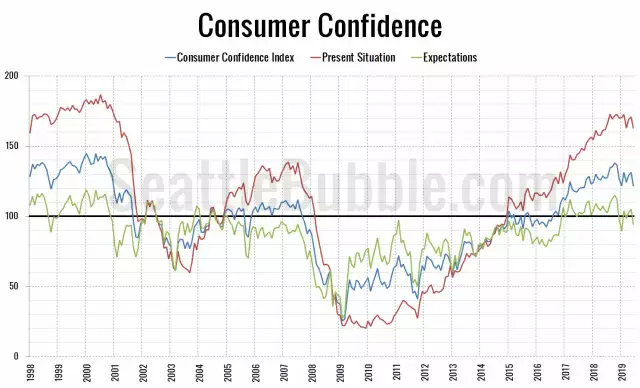
Case-Shiller Tiers: High Tier Price Drops Accelerate
Let's check out the three price tiers for the Seattle area, as measured by Case-Shiller. Remember, Case-Shiller's "Seattle" data is based on single-family home repeat sales in King, Pierce, and Snohomish counties.
Year-over-year price growth is falling in all three tiers, with the high tier having flipped to year-over-year losses as of February.
The post Case-Shiller Tiers:
... more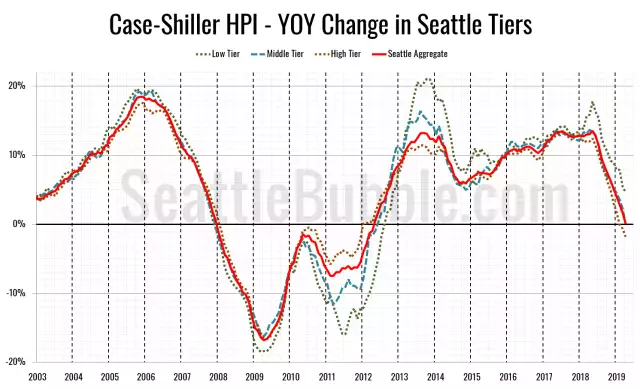
Case-Shiller: Seattle-Area Home Prices Flat in April
Let's play a bit of catch-up today with some stats that I've allowed to fall behind. First up, the latest Case-Shiller data from a couple weeks ago. According to April data that was released late June, Seattle-area home prices were:
Up 1.1 percent March to April Up less than 0.1 percent YOY. Up 30.9 percent from the July 2007 peak
Last year at this time prices were up 2.7 percent month-over-month and year-over-year prices were up 13.1
... more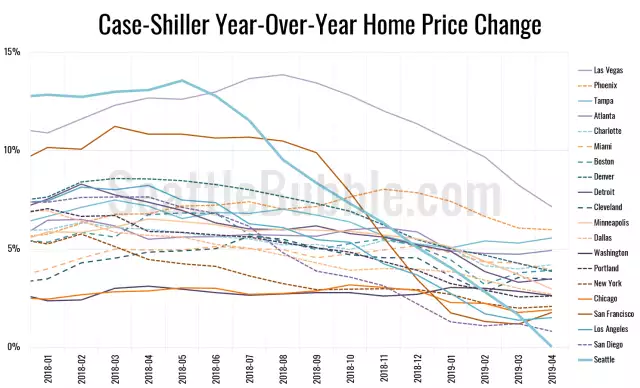
NWMLS: Listings up, sales flat, prices fall in May
The NWMLS published their May stats today, so let's take a look at how the month shook out for the housing market. The King County median price of single-family homes was down year-over-year in May, the third month in a row of declines. Inventory was up from a year ago again, but the as we mentioned in the preview post earlier this week, the rate of increase is rapidly declining from the all-time high set in December. Pending and closed sales are increasing, but only modestly.
... more
May Stats Preview: Not Dead Yet Edition!
Cheapest parts of King County still make up the largest share of sales, even as prices there grow the most
It's been a few months since we took a look at the in-county breakdown data from the NWMLS to see how the sales mix shifted around the county. I like to keep an eye on this not only to see how individual neighborhoods are doing but also to see how the sales mix shift affects the overall county-wide median price.
As of March, prices are up from a year ago in the low-end regions, flat in the mid-range regions, and down in the high-end regions. Meanwhile, the share of sales is tilting toward the low-end
... more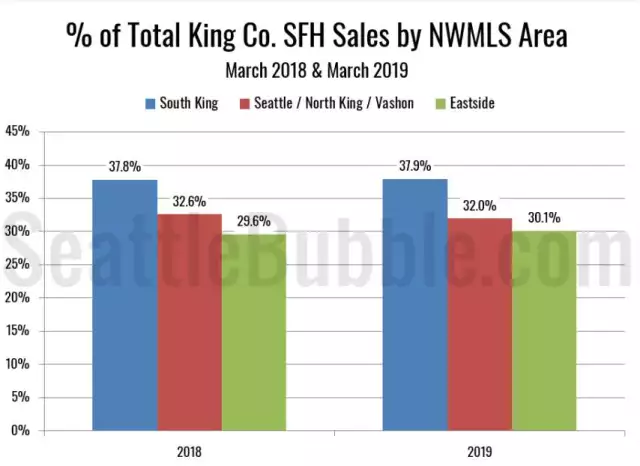
Around the Sound: Inventory up, sales down across the board
It's been a few months since we had a look at the stats in the broader Puget Sound area, so let's update our charts through March. Here's the latest update to our "Around the Sound" statistics for King, Snohomish, Pierce, Kitsap, Thurston, Island, Skagit, and Whatcom counties.
King County still has some of the most dramatic changes, as the only county with a drop in the median price and by far the biggest increase in active listings. That said, active listings are up and closed sales are down across
... more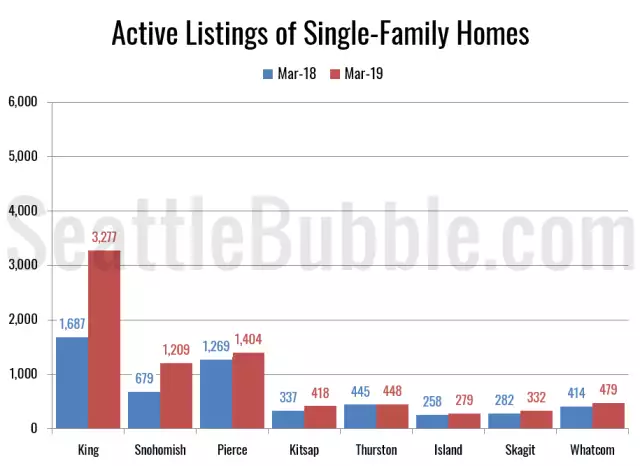
NWMLS: Prices down, listings way up, sales flat from a year ago
The NWMLS published their March stats today, so let's take a look at how the month shook out for the housing market. The King County median price of single-family homes was down year-over-year in March, falling more than it has since March of 2012. Inventory was up from a year ago again, but the increase was the smallest in the last five months. Pending sales recovered from the February snow storm dip, but were only up five percent…
The post NWMLS:
... more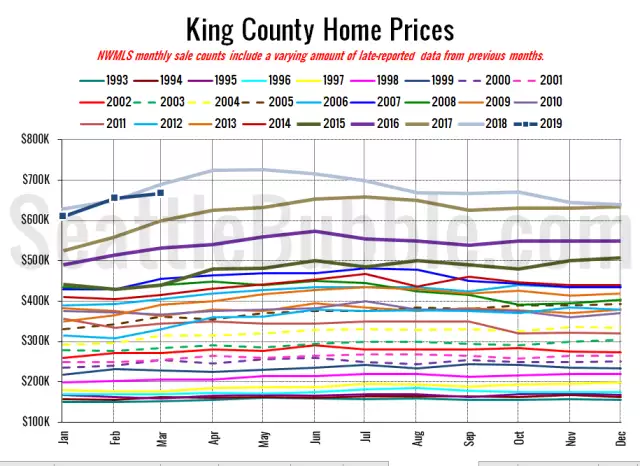
March Stats Preview: Inventory still up big, but gains slow even as home sales slip
Let's take a look at our early March housing stats.
Overall the market is still moving in a direction favorable to buyers, but more slowly than it was late last year. By March of this year inventory is already at levels that it didn't hit until May or June last year. Meanwhile, sales are still down from a year earlier. Foreclosures are still not really an issue at all right now…
The post March
... more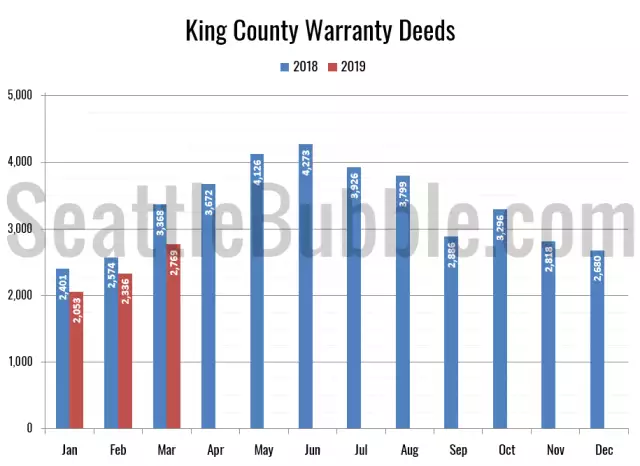
Case-Shiller: Seattle home price gains below average in January
It's been a while since we posted our Case-Shiller charts and dashboards, so let's have a look at the latest data from the Case-Shiller Home Price Index. According to January data that was released yesterday, Seattle-area home prices were: Down 0.3 percent December to January…
The post Case-Shiller: Seattle home price gains below average in January
... more
NWMLS: Home prices back in black, snow storm freezes out pending sales
Let's play some catchup and take a look at February market stats from the NWMLS. The King County median price of single-family homes was basically flat year-over-year in February, inventory was way up from a year ago but not by as much as it has been, and pending sales slipped thanks to the nasty weather…
The post NWMLS: Home prices back in black, snow storm freezes
... more