
Coy Davidson

Recent Healthcare Transactions - THE TENANT ADVISOR
The post Recent Healthcare Transactions appeared first on THE TENANT ADVISOR.
U.S. Retail Report | Winter 2022 - THE TENANT ADVISOR
The post U.S. Retail Report | Winter 2022 appeared first on THE TENANT ADVISOR.


Houston Industrial Market Report | Q3 2022
Fed Beige Book: CRE Sales Slowed, Industrial Leasing Remains Robust, While Office Demand Remains Tepid - THE TENANT ADVISOR

Houston Ranks 8th Nationally in Coworking Spaces - THE TENANT ADVISOR
Houston Office Market Report | Q3 2022 - THE TENANT ADVISOR

The U.S. Office Market is in Unchartered Territory - THE TENANT ADVISOR

Houston's Life Sciences Push - THE TENANT ADVISOR
Texas Medical Center Announces TMC BioPort campus
The Texas Medical Center announced plans for a 4th campus a massive biomanufacturing and medical supplies distribution center in Houston. TMC BioPort will be built on 500 acres south of Loop 610.
The newest campus is still in the early stages of development. However, once completed, it’s expected to double the overall size of the medical center and create 100,000 jobs for the Greater Houston metro, TMC President and CEO Bill McKeon said during
... more
U.S. Healthcare Services Report | Q3 2022 - THE TENANT ADVISOR
Medical Office Fundamentals Strengthen, But Providers Face Cost Pressures
Single-Tenant and Net Lease Sales Face Headwinds - THE TENANT ADVISOR
Fed Beige Book: CRE Activity Softened - THE TENANT ADVISOR
Overall Economic Activity
Economic activity was unchanged, on balance, since early July, with five Districts reporting slight to modest growth in activity and five others reporting slight to modest softening. Most Districts reported steady consumer spending as households continued to trade down and to shift spending away from discretionary goods and toward food and other essential items. Auto sales remained muted across most Districts, reflecting limited inventories and elevated prices. Hospitality
... more

Houston CRE Market Research | Mid-Year 2022 - THE TENANT ADVISOR
Job Growth Surges in Houston
The first half of ’22 was the strongest opening on record for Houston’s economy. Job growth surged. The unemployment rate fell. Houston’s civilian labor force grew significantly. Exports set a record. Container traffic soared. Crude topped $100 per barrel. The rig count approached pre-pandemic levels.
Metro Houston created 84,600 jobs in the first half of ’22. That’s the best start on record for the region, better than any year in the ’80s, when the
... more
 Houston’s office market posted negative net absorption in Q2 2022, recording (-224,211) square feet. The overall average vacancy rate rose marginally by 10 basis points between quarters from 23.4% to 23.5%. Office inventory remained unchanged, as no new inventory was added and there is 2.0 million SF of office space under construction. Average rental rates increased over the year. Houston’s Class A overall average full-service rental rate rose from $35.10 per square foot in Q2 2021 to $36.29 per square foot in Q2 2022. Leasing activity remained steady over the quarter, recording 2.9 million square feet, which includes renewals.
 Houston’s industrial market continued to gain momentum as leasing velocity reached over 10 million square feet in the second quarter. The increase in demand for space continued to spur new development with over 21 million square feet under construction and an additional 65 million square feet proposed or in the final planning stage. Houston’s industrial market recorded 6.6 million square feet of positive net absorption in the second quarter. The vacancy rate decreased 280 basis points annually from 8.5% in Q2 2021 to 5.7% in Q2 2022.
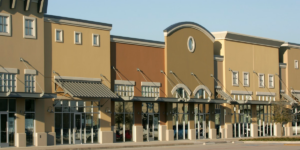 Houston’s vacancy rate decreased 50 basis points from 5.6% to 5.1% over the quarter as more inventory was leased than new inventory delivered. Houston’s retail sector recorded 1.3 million square feet of positive net absorption in the second quarter, pushing the year-to-date total absorption to 2.4 million square feet. Year-to-date leasing activity reached 3.1 million square feet, an increase of 24% when compared to mid-year 2021. The average asking rental rate increased 2.0% on an annual basis.
 Houston’s medical office building (MOB) market posted 531,293 square feet of positive net absorption in the first half of 2022, an increase over the 219,659 square feet recorded in the first half of 2021. The vacancy rate fell over the year from 13% to 12.1%. Houston’s MOB inventory increased slightly with 514,775 square feet of new inventory added in the second half of 2022 and there is 2.3 million SF of MOB space under construction. The average asking NNN rental rate rose annually from $22.80 per SF to $23.23 per SF. Transaction volume decreased on an annual basis and increased on a semi-annual basis. According to our data provider Revista, the 2022 mid-year transaction volume is just over $298.7 million and the average CAP rate is 6.17%.
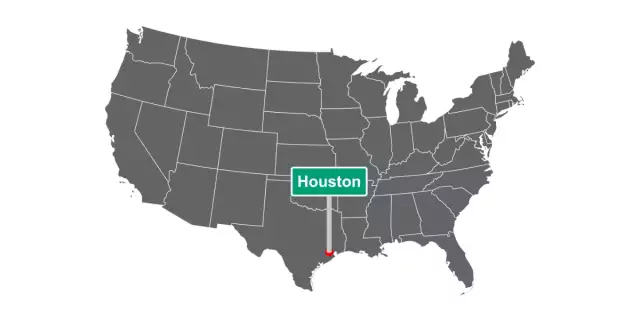
Another Record-Breaking Sales Quarter for CRE - THE TENANT ADVISOR

Texas Office Market Snapshot | Q2 2022 - THE TENANT ADVISOR
Office Occupancy is Increasing, but the Return to the Office Has Been Slow
Office return dates have been a moving target throughout the pandemic, particularly over the last 12 months, with plans being stalled by the Delta and Omicron variants in turn. Occupancy is comfortably above 50% in the leading Texas metros of Austin, Dallas, and Houston which has consistently been above other major markets according to Kastle’s Back to Work Barometer.
As we approach the end of the third quarter as
... more
 Austin has continued to outperform most comparable markets in both leasing and post-pandemic office use. We continued to see demand and competition for Class A offices in core markets (CBD and surrounding, along with the Domain), which led to relatively flat vacancy and average rates which continued to trend flat or slightly up. A mixture of high-tech and professional services led the way with new leases ranging from 60k to 220k rsf spread throughout the market. Suburban markets have continued to lag in activity resulting in a slight increase in overall vacancy, with a few Landlords (primarily far west) beginning to advertise lower rates and/or increased concessions.
 The Dallas-Fort Worth office market is showing mixed signals. Landlords are still pushing some of the highest rents the market has ever seen despite the highest recorded vacancy rate and minuscule absorption through mid-year. The second half of 2022 is poised for a strong rebound due to the fact that YTD leasing activity is up to pre-Covid levels. The biggest challenge the market faces right now is that many tenants still have not defined their work-from-home policies and are not quite sure if they need more space or should give some space back. Many companies are waiting to see what competitors do before making a decision.
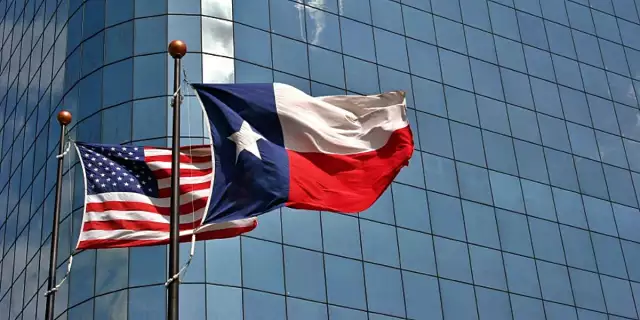
 Houston Highlights


 Investment sales volumes in the Houston medical office buildings (MOB) sector started off strong in 2022 but slowed in the second quarter of 2022.
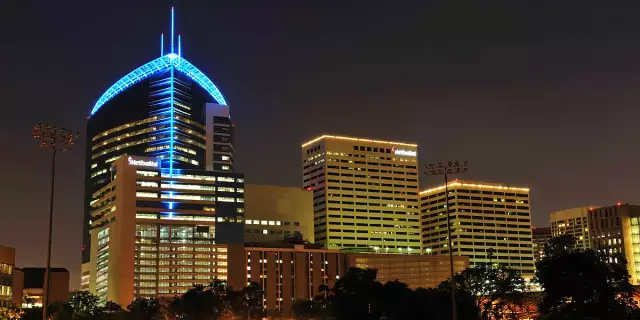

 The U.S. industrial sector continued to show its strength, posting favorable fundamentals through midyear. The remainder of 2022, however, should feel the pressure of the headwinds affecting the market – Amazon’s scaling back, continuous interest rate hikes, labor and supply issues, transportation costs, and land availability. The industrial sector is not immune to these challenges and may see occupiers scale back in the latter half of the year.
 The overall vacancy rate declined 121 basis points year-over-year to 3.7% at the end of the second quarter. This marks the lowest vacancy rate ever recorded in the U.S. Tightening markets and an abundance of new industrial supply drove up asking rents for warehouse/distribution space to $7.30 per square foot per year in the second quarter, 12.5% higher than the same time last year and the highest asking rent on record. As the pace of development surges and demand for final-mile facilities increases, industrial asking rents will continue to soar, especially in seaport and port-adjacent markets
Q2 2022 Austin Office Market Report - THE TENANT ADVISOR
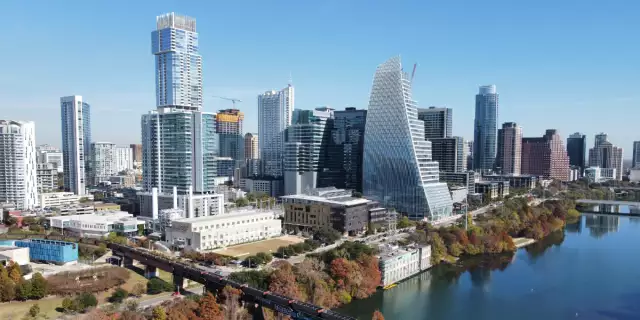
Austin has continued to outperform most comparable markets in both leasing and post-pandemic office use

 Austin has continued to outperform most comparable markets in both leasing and post-pandemic office use. We continued to see demand and competition for Class A offices in core markets (CBD and surrounding, along with the Domain), which led to relatively flat vacancy and average rates which continued to trend flat or slightly up. A mixture of high-tech and professional services led the way with new leases ranging from 60k to 220k rsf spread throughout the market. Suburban markets have continued to lag in activity resulting in a slight increase in overall vacancy, with a few Landlords (primarily far west) beginning to advertise lower rates and/or increased concessions.

2022 Q2 U.S. Office Market Outlook - THE TENANT ADVISOR

Q2 2022 | Dallas-Fort Worth Office Market Report - THE TENANT ADVISOR

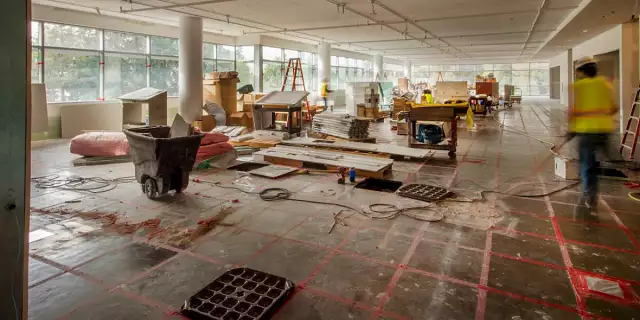
The Cost of an Office Build-Out (2022) - THE TENANT ADVISOR
2022 Q3 Healthcare Services Research Report - THE TENANT ADVISOR

Q2 2022 | Houston Retail Market Report - THE TENANT ADVISOR
