
CommercialCafe
Anchin Inks Deal for 46,000 Square Feet in Times Square

Fastest-Shrinking Jobs in the U.S. Lose Ground to New Technology
As we wrap a second year of highly dynamic shifts in the post-COVID economy landscape, we’ve been looking into job trends. First, we focused on the fastest-growing jobs in the U.S. and found that the healthcare and green energy industries accounted for some of the most thriving occupations of the last decade. We also wanted to take a look at the opposite end of the spectrum: Which occupations have seen the sharpest decline during that same time?
Using data from the Bureau of Labor Statistics’
... more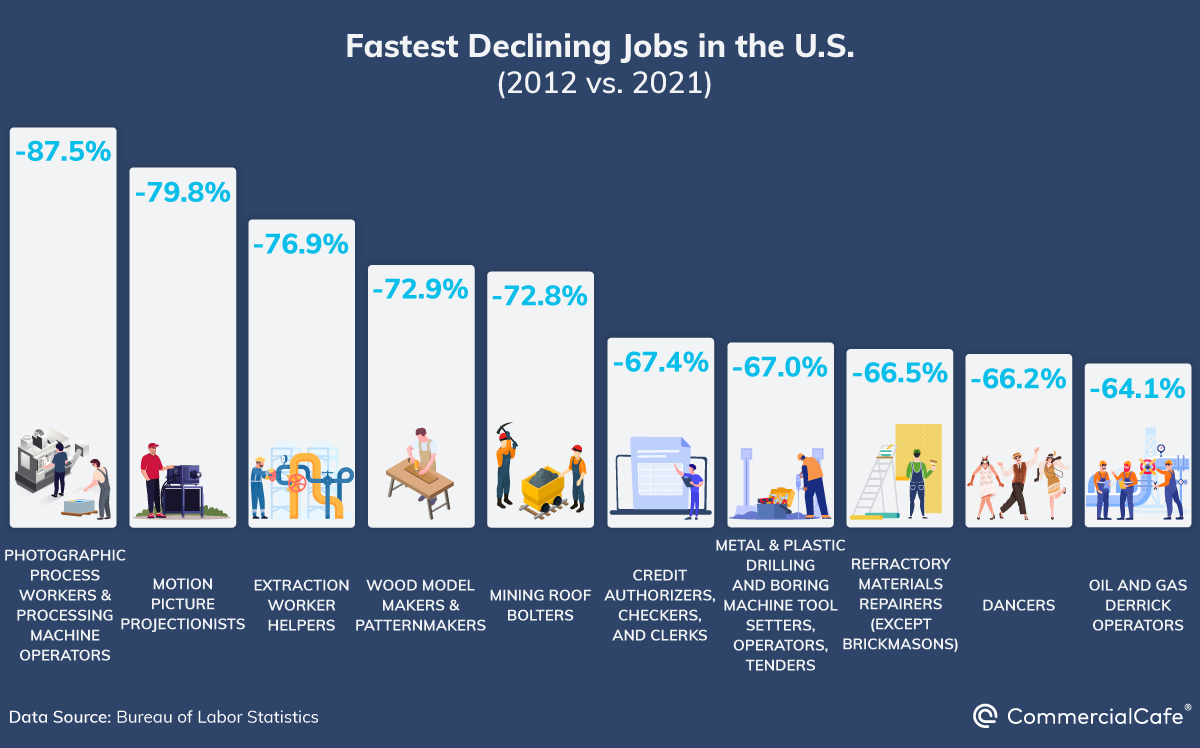

Newmark Brokers $150 Million Loan for Revamp of Textile Building
Newmark has brokered a financing deal totaling $150 million for the reconversion of the Textile Building in Midtown Manhattan. Dustin Stolly, Jordan Roeschlaub, Christopher Kramer, Nick Scribani, Ben Kroll, and Holden Witkoff were part of the team that secured the mortgage issued by Deutsche Pfandbriefbank — a German bank that specializes in real estate and public sector financing.
“Being able to secure financing for this type of product during this uncertain time speaks to the quality of the collective
... more
Bradmore Secures Construction Loan for West Los Angeles Creative Office

Empire Capital Lands $215 Million Acquisition Loan for Midtown Office
Business Group to Move into WeWork Offices in Downtown St. Louis
Healthcare & Green Jobs Head List of Fastest-Growing Occupations in U.S.
Key Highlights:
So, to better understand the pace and extent
... more
Prologis Unveils Plans for Alameda Crossings Studio Complex

Haystack Oncology Leases New Facility in Baltimore
Biotech firm Haystack Oncology recently inked a lease for 20,000 square feet of office and processing lab space at City Garage Science & Technology Center in South Baltimore. The owner of the 135,000-square-foot life sciences building, located at 101 W. Dickman St., is Rockville, Md.-based commercial real estate investor South Duvall.
The tenant was represented by Mark Deering, a partner with MacKenzie Commercial Real Estate Services, while Nate Crowe of Scheer Partners negotiated on behalf of
... more
Marx Realty Signs Trio of Fintech Tenants at 10 Grand Central
Having already secured the likes of Merchants Bancorp, Bucks Productions, and online news magazine The Week as part of its roster, Marx Realty recently closed on three more lease deals with fintech companies at 10 Grand Central. Specifically, Fin Capital will occupy 5,212 square feet on the 33rd floor of the 35-story Midtown Manhattan office. Meanwhile, DIF Capital Partners and Colibri Equity Ventures will open their offices on the 23rd floor, having agreed to 3,745 square feet and 2,915
... more
Slate Office REIT to Buy Pfizer-Leased Property in Lake Shore

Q3 2022 CommercialEdge Office Report: Demand for Coworking Continues to Drive Growth

BOMA Releases New COVID-19 Tenant Impact Survey - CommercialCafe

Logistics Firm Leases Two Compton Warehouses | CommercialCafe

Related Secures Construction Loan for One Flagler | CommercialCafe
LuminUltra Inks Lease for New Headquarters at BWI Tech Park
Applied molecular diagnostics firm LuminUltra has penned a lease deal with St. John Properties for 14,000 square feet at 805 Pinnacle Drive in Linthicum, Md. The Canadian company will relocate its U.S. headquarters to the new facility located within BWI Tech Park — a 156-acre business campus that encompasses more than 1 million square feet of Maryland commercial real estate, including office, flex, R&D and retail space.
Lacey Johannson negotiated on behalf of the owner, while MacKenzie Commercial
... more
O’Melveny & Myers Plans Move to 1301 Avenue of the Americas

US Commute Times & Remote Work (2021 vs. 2019) | CommercialCafe
Although remote work was not unheard of prior to the COVID-19 pandemic lockdowns, the ample wave that rose in 2020 continues to ripple through the national workscape. And, although there is still some debate regarding a fully flexible future of work, the movement has so far brought certain undeniable benefits: Whether it has to do with evolving energy costs, health concerns, or investing that time toward more issues of personal value, cutting down on at least some of the previous commute time has been highly
... more
Truist Inks Lease Deal at 50 Hudson Yards | CommercialCafe

Bright MLS Inks Deal for 13KSF in Bethesda - CommercialCafe
National real estate listings company Bright MLS will occupy 13,455 square feet of office space at Federal Realty-owned Pike & Rose in Bethesda, Md. The new lease will allow Bright MLS to move out of its previous location at 9707 Key West Ave. near Johns Hopkins University’s Montgomery County campus.
The negotiations were handled by JLL’s Bernie McCarthy and Danny Sheridan on behalf of the landlord, with Bob Dickman and Rusty McCabe of Avison Young representing the tenant.
With
... more
National Office Report Notes Coworking Growth | CommercialCafe

Expert Insights: Sara Malek Barney Discusses Office Interior Design - CommercialCafe

Home Depot Leases 500,000 Square Feet at Duke Realty Warehouse in LA County


Expert Insights: Christine Mastandrea Discusses Texas Commercial Real Estate - CommercialCafe

Kaufman Borgeest & Ryan Signs New Lease Deal for Midtown Office
Law firm Kaufman Borgeest & Ryan recently closed a 15-year lease deal at Global Holding’s 875 Third Ave. The company will occupy 27,000 square feet of prime Manhattan office space located between East 52nd and East 53rd streets, marking a significant downsizing from its current 48,000-square-foot lease at Silverstein Properties’ 120 Broadway. The move reflects a wider trend of companies adjusting their office space needs to accommodate employees’ preferences for flexible work schedules.
... more
Yardi Launches New Coworking Space Platform CoworkingCafe.com
Yardi, an industry-leading property investment and management software development company, recently announced the expansion of its suite of tools for coworking spaces with the launch of CoworkingCafe.com, as well as the acquisition of CoworkingMag.com.
CoworkingCafe.com offers a seamless experience to research and book coworking spaces in a single app, thereby allowing freelancers, entrepreneurs and digital nomads to check real-time availability of coworking spaces across the U.S.; filter them by
... more
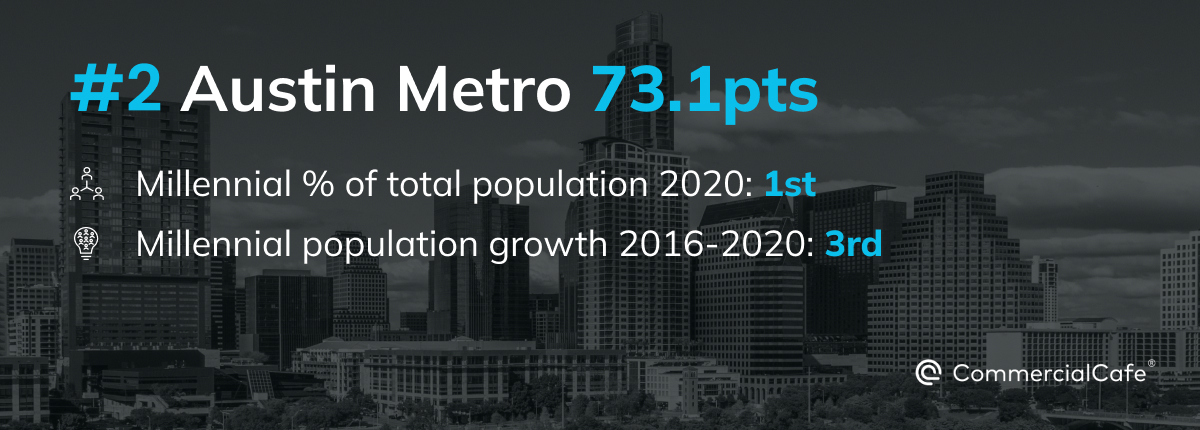
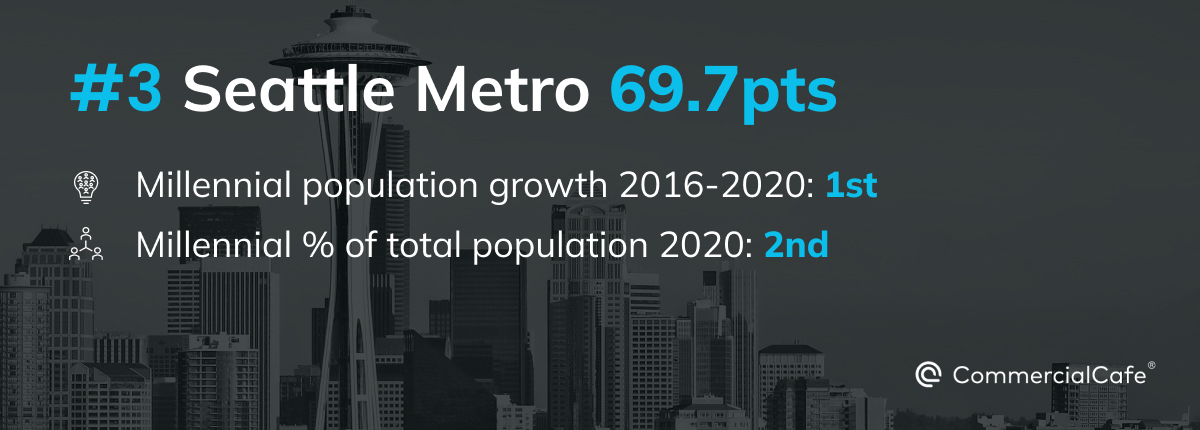
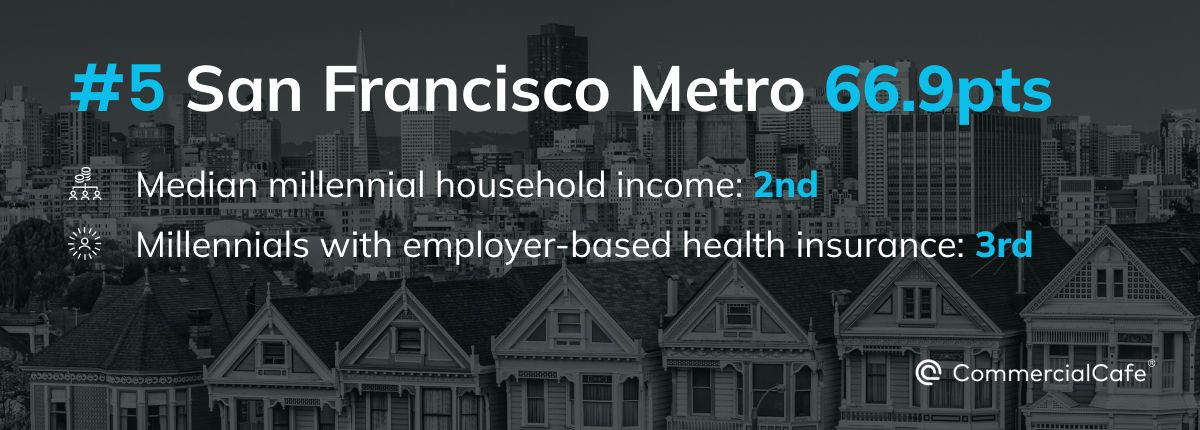
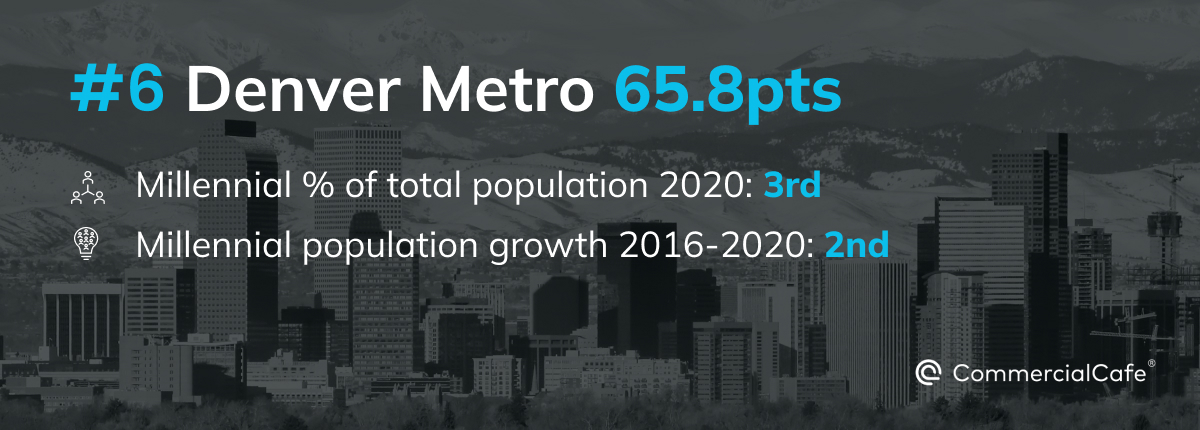
2022 Update: Top 10 Metros for Millennials Who Want to Relocate
Nearly 72 million people living and working in the U.S. today are part of what’s commonly referred to as the Millennial generation, which currently represents the most significant cohort of the country’s demographics. And, given their outsized role within the nation’s economy and influence on everything from culture to the social and political spheres, CommercialCafe has made a concerted effort to track their movements and preferences throughout the years.
For instance, prior to the onset of
... more


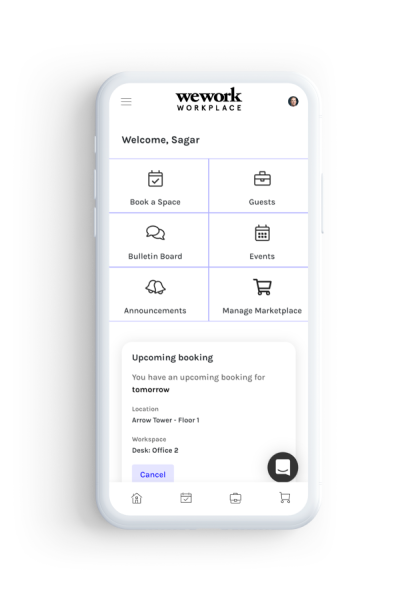
WeWork in Partnership with Yardi Launches WeWork Workplace: An End-to-end Platform for Employee Experience and Workplace Management
The office, as we all know it, has fundamentally changed. There is a paradigm shift we are seeing across office occupiers where employees are demanding more flexibility and meaningful collaboration opportunities. Employers are racing to find a sweet spot between team productivity, employee experience and real estate costs.
While many companies are pulling back on fully remote work in favor of bringing employees back to the office, approximately 82% of the employers indicate that the requirement for
... more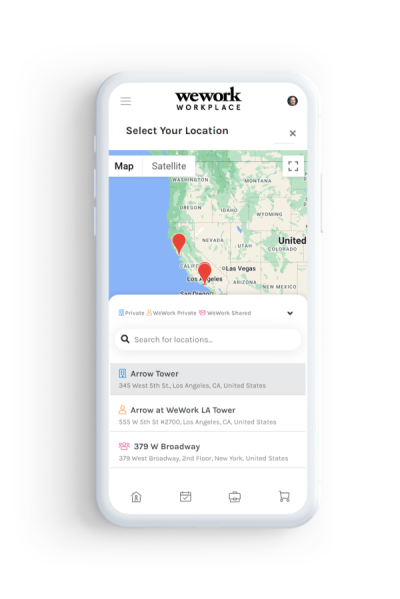

Top US Metros for Life Science in 2022 | CommercialCafe