birminghamappraisalblog
7 Common Mistakes Sellers Should Avoid During a Real Estate Appraisal • Birmingham Appraisal Blog
3 Types Of Appraisals Realtors Should Be Aware Of • Birmingham Appraisal Blog
How Agents Can Adjust For Square Footage • Birmingham Appraisal Blog
How Was The Housing Market in 2022? • Birmingham Appraisal Blog
Do You Have A Tech-Savvy Appraiser? • Birmingham Appraisal Blog
5 Ways Homeowners Can Save Money • Birmingham Appraisal Blog
What Does A Real Estate Appraisal Include? • Birmingham Appraisal Blog
Are You Pricing Your Home Too High For Today's Market? • Birmingham Appraisal Blog
What is External Obsolescence? • Birmingham Appraisal Blog
5 Things To Consider When Getting A Hybrid Appraisal • Birmingham Appraisal Blog
What Is A Final Inspection? • Birmingham Appraisal Blog
New Homebuyer's Guide To Appraisals • Birmingham Appraisal Blog
6 Things To Consider When Comparing Your Home To Recent Neighborhood Sales • Birmingham Appraisal Blog
Pricing a Home In A Softening Market • Birmingham Appraisal Blog
6 Ways Agents Can Use Their MLS Listings To Help Appraisers • Birmingham Appraisal Blog
Are Buyers In The Driver's Seat Now? • Birmingham Appraisal Blog
6 Reasons Your Home May Not Appraise In Today's Market • Birmingham Appraisal Blog
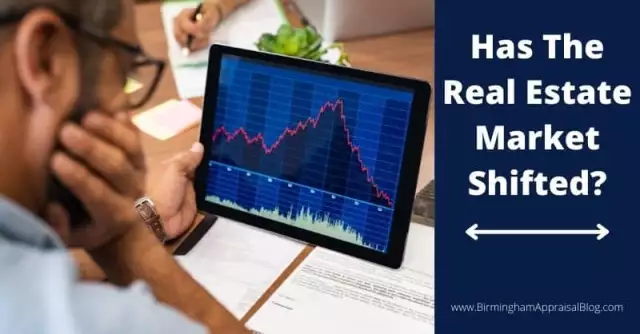
Is The Real Estate Market Shifting? • Birmingham Appraisal Blog
From all indications, there has been a definite shift in the real estate market. The recent increase in interest rates has injected another variable into the market that participants are reacting to.
... moreFrom all indications, there has been a definite shift in the real estate market. The recent increase in interest rates has injected another variable into the market that participants are reacting to.
I like to get multiple perspectives on what is happening and in order to do that I review stats from multiple sources such as the Greater Alabama MLS, Redfin, and Altos Research to name a few. A lot of time the actual numbers from these sources may vary slightly, however, the general market trends do correlate well with each other. Some of the key stats I like to consider to get a read on the market include the number of active listings, trends in price reductions, pending sales, days on market, and months (or weeks) of housing supply. It’s never a good idea to look at only one statistic as it could be misleading so I like to get an overall picture of what is happening and the best way to do that is to look at the market from multiple perspectives.
Today I’m going to look at the trend in the first six months of 2022 and compare that to the two prior years. This will show us how the market was affected by COVID and how the market is doing approximately 27 months after we went into lockdown.
1) Active Listings – Active listings in both Jefferson and Shelby County have increased since February. While there is some historical support for an upward trend, it appears this trend is larger than normal.
There are several reasons that this could occur. The first is that sales could be slowing down while new listings continue to enter the market. The net effect would be an increase in the listing count.
The second reason could be that sales are continuing at a normal rate and there is an abnormal spike in new listings. Data from Altos Research seems to indicate a combination of both factors.
Within the past 4-6 weeks there has been both an increase in the number of listings and a decrease in sales. Given that this is the home buying season the numbers tend to suggest that recent home sales have been suppressed. This is most likely caused by the increase in interest rates.
2) Price Reductions – A change in price reductions can provide support for a shift in the market as well. From 2019 to 2021 the percent of Active Listings in Jefferson County with price drops had decreased, however, in mid-April of this year, the trend has continued to rise and has surpassed the past 4 years to 4.4%, compared to the low last year of 2.5%. The trend ins Shelby county is similar.
This is yet another indication of a shifting market. Sellers have had the upper hand over the past several years and have not had to even think about lowering the price of their homes.
A decreased pool of potential buyers due to higher interest rates has resulted in less competition. Some sellers may have priced their homes based on the past six months of market frenzy, however, they are now realizing that we are now in a different market.
3) Pending Sales – The current number of pending sales is an early look at what the closed number of sales will look like in the coming month(s). It is a good snapshot of current market activity.
Historical figures indicate a steady to increasing number for this statistic, however, we are not seeing that trend in 2022. Within the past week, pending sales in Shelby County plunged to the lowest in the past 3 years after seeing an upward trend in the first quarter. Again, the trend for Jefferson County is similar.
4) Days on Market – We are still seeing a declining number of days on market from list date to sale date. While some areas of the market are shifting, there is still an imbalance in supply and demand.
The lower days on market reflect the speed at which the available inventory is being purchased. Don’t expect this stat to change too much unless we see big changes in supply, which I discuss below.
5) Months of Supply – Beginning in 2020 we have seen lower months of inventory each year and 2022 is no exception. What we have seen over the past several weeks is an upward trend.
Over the past several weeks the months of supply have matched that of 2021. This is different than the prior three years when supply was significantly lower than the year before.
Again, this is significant because the housing inventory is starting to build back up which may give buyers more options when shopping for a house. Sellers will want to take this into consideration in their pricing strategy because of more competition.
Conclusion
With all that I have reported here please don’t think that the real estate market is tanking. We have seen unprecedented increases in sales prices due to supply and demand dynamics, however, we have to realize that things have changed and we may not be in the same market we were 6, 12, or 18 months ago.
Just as a football coach must change his play calling based on how the other team has lined up, sellers must changed their game plan on pricing based on what is currently happening in the market.
The recent increase in interest rates has affected potential buyers. Because they were increased this has taken some buyers out of the market because they cannot afford the higher payments.
With fewer buyers, there is decreased competition for the available inventory and this has resulted in buyers needing to readjust their list price. My best advice is to price to the current market and not to what was happening 3 months ago because if you do the appraisal may come out lower than the contract price which was arrived at using old sales data.
Question
Do you have any questions about the local real estate market? If I can answer any appraisal questions for you do not hesitate to contact me and as always thanks for reading.
If you liked this post subscribe by email (or RSS feed).
lessDo I Need A Probate Appraisal? • Birmingham Appraisal Blog
Agents, Are You Pricing For Today's Market or Yesterday's? • Birmingham Appraisal Blog
A Quick Look At The Birmingham Housing Market: First Quarter 2022 • Birmingham Appraisal Blog
With the first quarter of 2022 under our belts, I thought I would take a quick look at how the numbers stack up against past years, and for March.
... moreWith the first quarter of 2022 under our belts, I thought I would take a quick look at how the numbers stack up against past years, and for March.
We’ll take a look at some key metrics including sales volume, median sales price trends, days on market, the sale price to list price ratio, active listings, and months of supply.
Number of Homes Sold The number of homes sold is a key indicator of market activity. There is a direct relationship between the health of the market and buyer activity.
While the number of home sales for the first quarter as well as March is down from last year, it is higher than the prior years. Last year was record-breaking in many areas, so to only compare the present activity against it would not be fair.
If we continue to see a trend that might signal a shift in the market, so we’ll want to keep our eyes on what is happening. Will the continued increase in interest rates have a big impact on home sales?
Median Sales Price Median home prices continue to rise as a result of high demand and limited inventory. First-quarter stats show a steady increase from 2017 to the present.
A shocking stat to me was the steep increase in median prices for the month of March from 2017 to 2022. In March of 2017 the median price, as reported by the Greater Alabama MLS was $189,000 compared to March of 2022, which came in at $310,000, an increase of 64%.
This increase, combined with higher interest rates, may keep many buyers out of the market as rates continue to rise. I believe that the increase in institutional buyers has driven prices up and contributed to the frustration buyers experience when they lose deals.
When this happens they are more willing to make an over-the-list price offer the next time they find a house they like which continues the cycle of price increases.
Days on Market The amount of time a home stays on the market before going under contract continues to decline as buyers snatch up what limited inventory is available. While there is some seasonality to this stat the overall downward trend is still present.
This stat is tied directly to the type of market we are in. We are currently in a seller’s market, with limited housing inventory, and buyers are quick to make an offer before another motivated buyer beats them to it.
In a buyer’s market, the inventory is much higher and buyers have more choices. Houses tend to stay on the market longer which increases the days on the market stat.
Sale Price to List Price Ratio The big story in the Birmingham area, as well as other areas of the country, has been how many homes have been selling for over their list price. As I just noted, this is a direct result of buyers who want to make sure they win the offer, both individuals and investors.
Investors have deep pockets and they are willing to pay an over-the-market price due to the good rental market since the homes they buy will typically be rental units. This is true of new homes as well and many builders are starting to build homes specifically to sell to the investment buyer who will put the home on the rental market.
Individual buyers are being aggressive as well if they are lucky enough to find a home to make an offer on. Losing out on past deals has motivated them to make their best offer upfront in hopes of winning the deal.
Number of Active Listings If we want to get a true feel for what is going on in the real estate market we need to keep an eye on the number of active listings. If they rise it could signal a softening of the market.
Year over year numbers from 2017 to 2022 is down for active listings. This is nothing new since we all know that overall inventory levels have been historically low.
It will be important to keep an eye on the change in inventory throughout 2022 as interest rates continue to rise. If they rise high enough a lot of buyers will drop out of the market because they cannot afford the payments.
If enough buyers leave, this could result in less competition and more inventory staying on the market. Will it be significant? We’ll have to wait and see.
Months of Supply The number of months of supply stat is a measure of the number of active listings and the recent rate of sales. A low inventory and a high rate of sales result in lower months of supply.
If interest rates rise enough to knock a significant number of buyers out of contention to purchase a home, and the inventory increases the months of supply will increase. This will be another metric to help us gauge the health of the market.
Remember that in a balanced market there are anywhere from 4-6 months of inventory. Anything less than four months would be a seller’s market and anything more than 6 months would be a buyer’s market.
While we are pretty far away from a balanced market we still need to at least look to see what direction we are headed. This will help us to understand what is going on.
Question Do you have any questions about the local real estate market? If so, let’s connect. You can leave a comment below or reach me through any of my social media channels. As always, thanks for reading.
If you liked this post subscribe by email (or RSS feed).
less
How High Will The Birmingham Real Estate Market Get?
Where Is The Birmingham Real Estate Market Headed? Just when you think the Birmingham real estate market can’t get any higher, it does. When I say high, I’m not only talking about sale prices but the number of offers as well. Even though it’s not the highest price ever paid in this area, there was […]
The post How High Will The Birmingham Real Estate
... moreWhere Is The Birmingham Real Estate Market Headed? Just when you think the Birmingham real estate market can’t get any higher, it does. When I say high, I’m not only talking about sale prices but the number of offers as well. Even though it’s not the highest price ever paid in this area, there was […]
The post How High Will The Birmingham Real Estate Market Get? appeared first on Birmingham Appraisal Blog.
Related posts:- How might the new Collateral Underwriter affect appraisers, agents, and loan closings?
- The Brady Bunch House Renovation And Thoughts On Value
- Unintended Consequences of the Coronavirus Pandemic
Birmingham Median Home Prices: Feb ’21 vs Feb ’22
A Look At February Year Over Year Median Sales Price In Birmingham So how’s the Birmingham real estate market looking? This is a question I get asked frequently since I am a real estate appraiser. There are a lot of different ways to look at the real estate market. Today I thought I would focus […]
The post Birmingham Median Home Prices: Feb ’21 vs Feb ’22
... moreA Look At February Year Over Year Median Sales Price In Birmingham So how’s the Birmingham real estate market looking? This is a question I get asked frequently since I am a real estate appraiser. There are a lot of different ways to look at the real estate market. Today I thought I would focus […]
The post Birmingham Median Home Prices: Feb ’21 vs Feb ’22 appeared first on Birmingham Appraisal Blog.
Related posts:- A Look At Home Sales In Birmingham’s Eastlake Neighborhood
- Pelham, AL home sales by the numbers- A look at 2013 vs. 2012
- 5 Stats that describe the Birmingham AL real estate market
Understanding The Appraisal Part 3: The Cost Approach
A Closer Look At The Cost Approach There are three approaches to value that can be used in a residential appraisal. They are the sales comparison approach, the income approach, and the cost approach. Today I will be explaining the cost approach to value. This approach is not given as much attention as the sales […]
The post Understanding The Appraisal Part 3: The Cost Approach
... moreA Closer Look At The Cost Approach There are three approaches to value that can be used in a residential appraisal. They are the sales comparison approach, the income approach, and the cost approach. Today I will be explaining the cost approach to value. This approach is not given as much attention as the sales […]
The post Understanding The Appraisal Part 3: The Cost Approach appeared first on Birmingham Appraisal Blog.
Related posts:- Anatomy of a Sales Comparable
- If you need a speaker at your real estate sales meeting, I can help you
- Can the cost approach be used over the sales comparison approach since it’s higher?
Why Do I Owe Taxes This Year? Seven Common Reasons
Understanding The Appraisal Part 1: What is “Adjusted sale price of comparables”?
Understanding The Adjusted Sale Price of Comparables I’m kicking off a short series to help readers of an appraisal report understand what they are looking at. It seems sometimes that the only two things that most people are concerned about with an appraisal are how fast can you get it to them and what is […]
The post Understanding The Appraisal
... moreUnderstanding The Adjusted Sale Price of Comparables I’m kicking off a short series to help readers of an appraisal report understand what they are looking at. It seems sometimes that the only two things that most people are concerned about with an appraisal are how fast can you get it to them and what is […]
The post Understanding The Appraisal Part 1: What is “Adjusted sale price of comparables”? appeared first on Birmingham Appraisal Blog.
Related posts:- If you need a speaker at your real estate sales meeting, I can help you
- What does the appraiser do when there are no comps?
- What is the FHA rule for electrical outlets?