U.S. Construction Spending Up 1.1% in June - Real Estate Investing Today
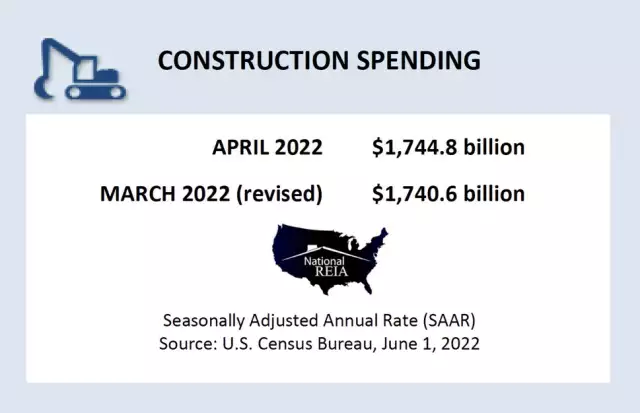
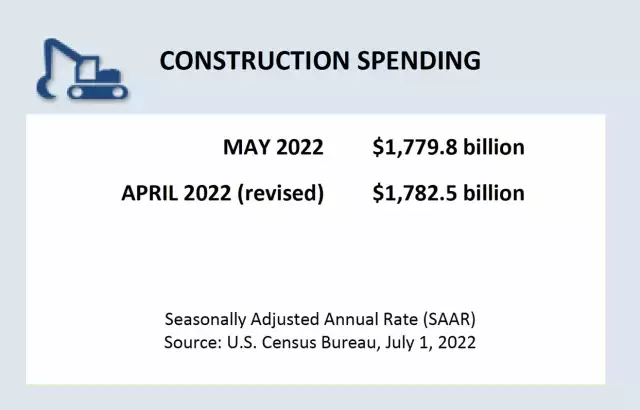
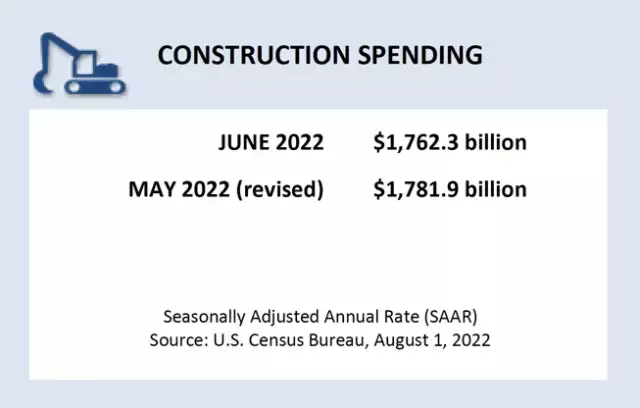
The U.S. government is reporting that total construction spending in June, 2022 was at a seasonally adjusted annual rate of $1,762.3 billion, which is 1.1% higher than May’s revised estimate and 8.3% higher than one year ago. Residential construction came in at a seasonally adjusted annual rate of $923.7 billion in June, which is 1.6% lower than May’s revised estimate.
Click here to read the full report at the U.S. Census Bureau.
- News |
- building |
- census |
- census-bureau |
- construction |
- data |
- economy |
- housing
You can contact us to get more choices
0
You can contact us to get more choices
Related posts
The U.S. government is reporting that total construction spending in June, 2022 was at a seasonally adjusted annual rate of $1,762.3 billion, which is 1.1% higher than May’s revised estimate and 8.3% higher than one year ago. Residential construction came in at a seasonally adjusted annual rate of $923.7 billion in June, which is 1.6% lower than May’s revised estimate. Click here to read the full report at the U.S. Census Bureau.
The U.S. government is reporting that total construction spending in April, 2022 was at a seasonally adjusted annual rate of $1,744.8 billion, which is 0.2% lower than March’s revised estimate and 12.3% higher than one year ago. Residential construction came in at a seasonally adjusted annual rate of $891.5 billion in April, which is 0.9% higher March’s revised estimate. Click here to read the full report at the U.S. Census Bureau.
The U.S. government is reporting that total construction spending in May, 2022 was at a seasonally adjusted annual rate of $1,779.8 billion, which is 0.1% lower than April’s revised estimate and 9.7% higher than one year ago. Residential construction came in at a seasonally adjusted annual rate of $938.2 billion in May, which is 0.2% higher April’s revised estimate. Click here to read the full report at the U.S. Census Bureau.
A recent report from the U.S. Bureau of Economic Analysis says that, in April, personal income increased $89.3 billion, or 0.4% at a monthly rate, while consumer spending increased $152.3 billion, or 0.9%. Interestingly, the personal saving rate dropped slightly to 4.4% in April compared with 5% in March. Also, note the 26.9% drop in fuel spending thanks to higher gas prices. Click here to read the full report at the BEA.
The National Association of Realtors is reporting that pending home sales were down 8.6% in June, 2022. The NAR’s Pending Home Sales Index (a forward-looking indicator based on contract signings) dipped to 99.1. The NAR predicts home sales should start to rebound by early 2023. Indeed… “Home sales will be down by 13% in 2022, according to our latest projection…With mortgage rates expected to stabilize near 6% and steady job creation, home sales should start to rise by early 2023..
...
According to the latest U.S. Home Flipping Report from ATTOM, 115,198 single-family houses and condominiums were flipped in Q2, 2022 representing 8.2% of all home sales in Q2. Interestingly, ATTOM points out that profit margins improved in Q2 as median resale price trends on flipped homes greatly improved. Specifically, the typical resale price on flipped homes reached another all-time high in Q2 of $328k up 21.5% from the same period one year ago. “The second quarter was another strong sh...
The U.S. government is reporting that total construction spending in March, 2022 was at a seasonally adjusted annual rate of $1,730.5 billion, which is 0.1% higher than February’s revised estimate and 11.7% higher than one year ago. Residential construction came in at a seasonally adjusted annual rate of $882 billion in March, which is 1% [...]
The post Construction Spending Up Slightly in March appeared first on Real Estate Investing Today.
The U.S. Government is reporting that sales of new single-family houses in June, 2022 were at a seasonally adjusted annual rate of 590k, which is 8.1% lower than May’s revised rate and is 17.4% lower than one year ago. The median sales price of new houses sold in September was $402,400k with an average sales price of $456,800. There were an estimated 457k new houses for sale at the end of March representing a 9.3-month supply at the current sales rate. Click here to read the full report a...
A recent chart from the Visual Capitalist illustrates how U.S. consumer debt is rapidly approaching a record-breaking $16 trillion. In addition, they point out that the rate of increase in consumer debt for Q4 2021 was also the highest seen since 2007. Stay safe and have a Happy Friday!!! “Economists believe that today’s housing debt [...]
The post U.S. Consumer Debt Approaches $16 Trillion appeared first on Real Estate Investing Today.
The U.S. government is reporting that privately‐owned housing starts in August were at a seasonally adjusted annual rate of 1,575,000, which is 12.2% higher than July’s revised number and 0.1% lower than one year ago. August’s rate for units in buildings with five units or more was 621k. Privately‐owned housing units authorized by building permits in August were at a seasonally adjusted annual rate of 1,517,000, which is 10% lower than July’s revised number. Authorizations of uni...