Case-Shiller: Seattle-Area Home Prices Flat in April
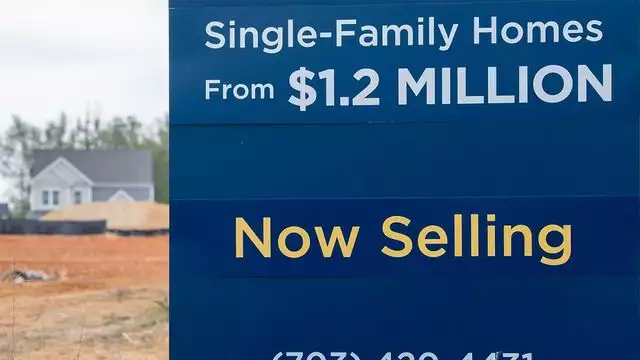
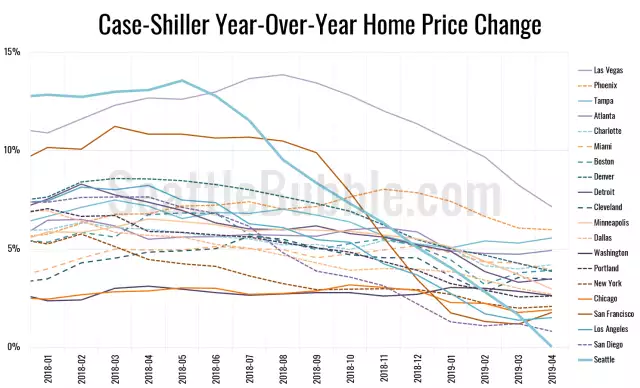
Let's play a bit of catch-up today with some stats that I've allowed to fall behind. First up, the latest Case-Shiller data from a couple weeks ago. According to April data that was released late June, Seattle-area home prices were:
Up 1.1 percent March to April Up less than 0.1 percent YOY. Up 30.9 percent from the July 2007 peak
Last year at this time prices were up 2.7 percent month-over-month and year-over-year prices were up 13.1 percent.
The post Case-Shiller: Seattle-Area Home Prices Flat in April appeared first on Seattle Bubble.
You can contact us to get more choices